Research
Mobile phones, connected vehicles, and wearable sensors generate huge amounts of data on how people move. My work uses this data to estimate travel demand, forecast future flows with AI, and run fine-grained citywide traffic simulations.
An LLM agent takes forecasted trips and runs them in mainstream traffic simulators (Vissim, SUMO, DTALite, MATSim). The LLM picks the right tool, sets the parameters, and writes the behavior plans, so citywide simulations can be built directly from mobile location data.
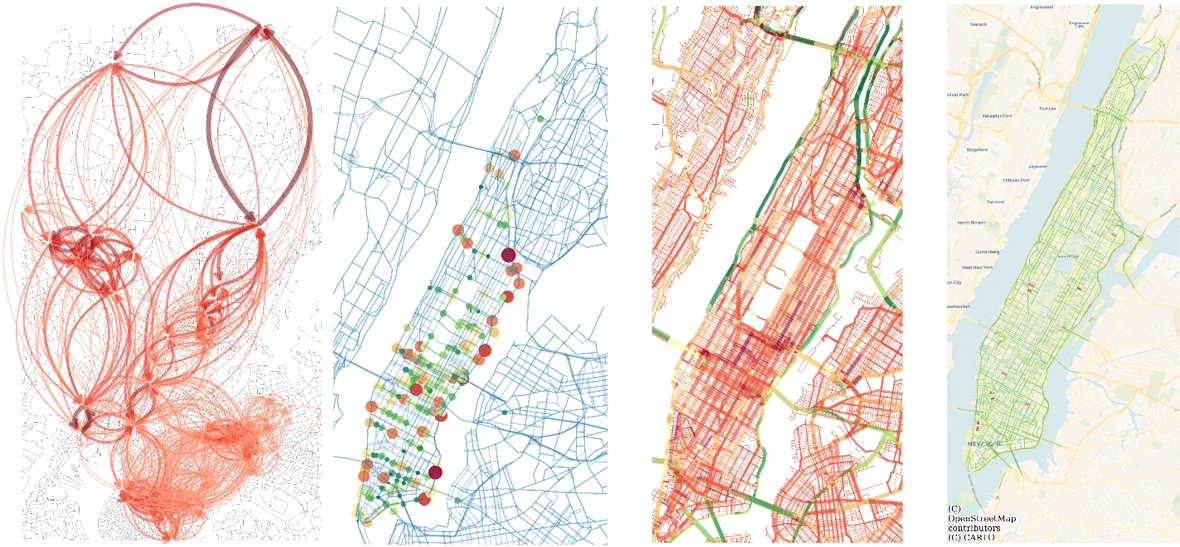
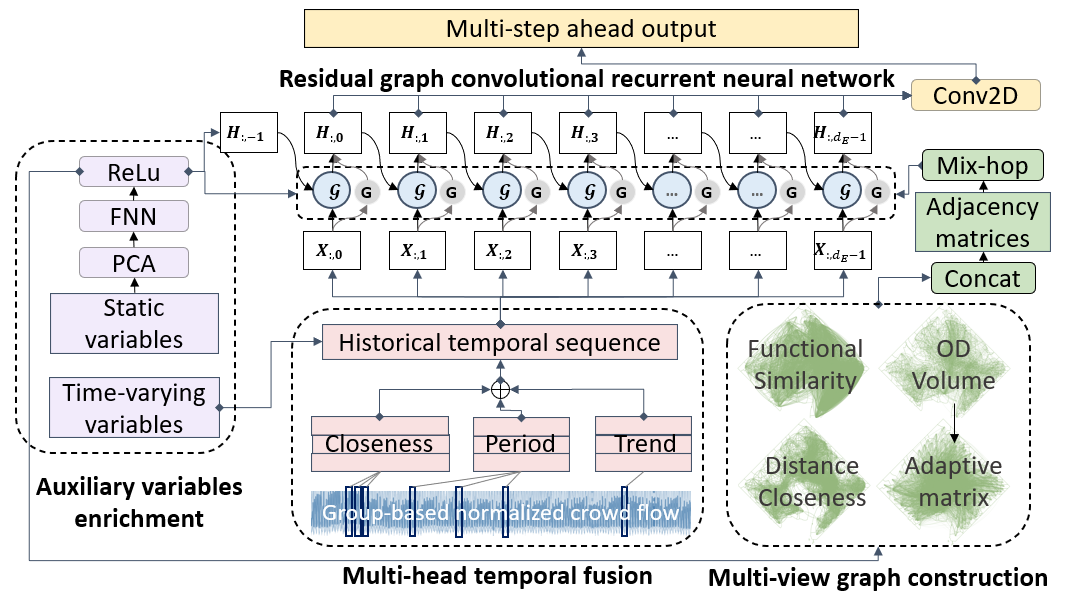
Multi-ATGCN (Multi-graph Multi-head Adaptive Temporal Graph Convolutional Network) forecasts citywide origin-destination flows in the future. It learns the spatial structure from multiple graphs and adapts to real-time conditions, outperforming strong baselines on several datasets.
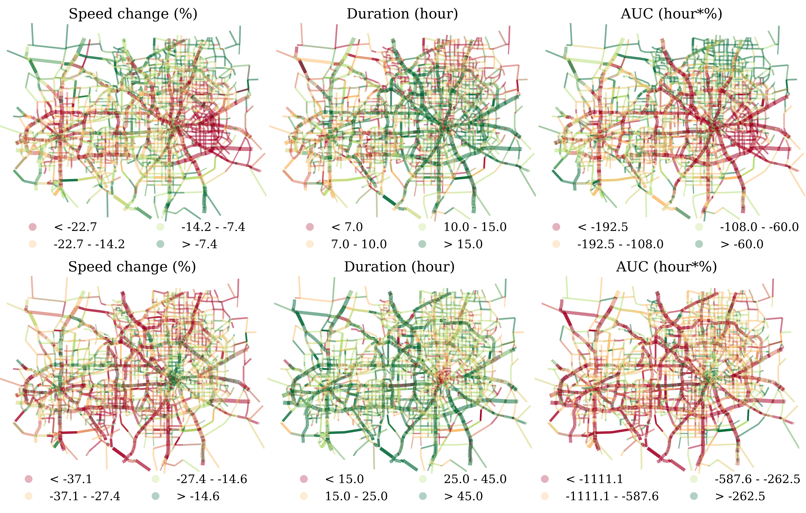
Transport remains a major source of greenhouse gases and air pollution. My work develops low-cost methods to monitor and predict emissions at scale, advances vehicle electrification, and evaluates urban policies such as speed limits and demand management.
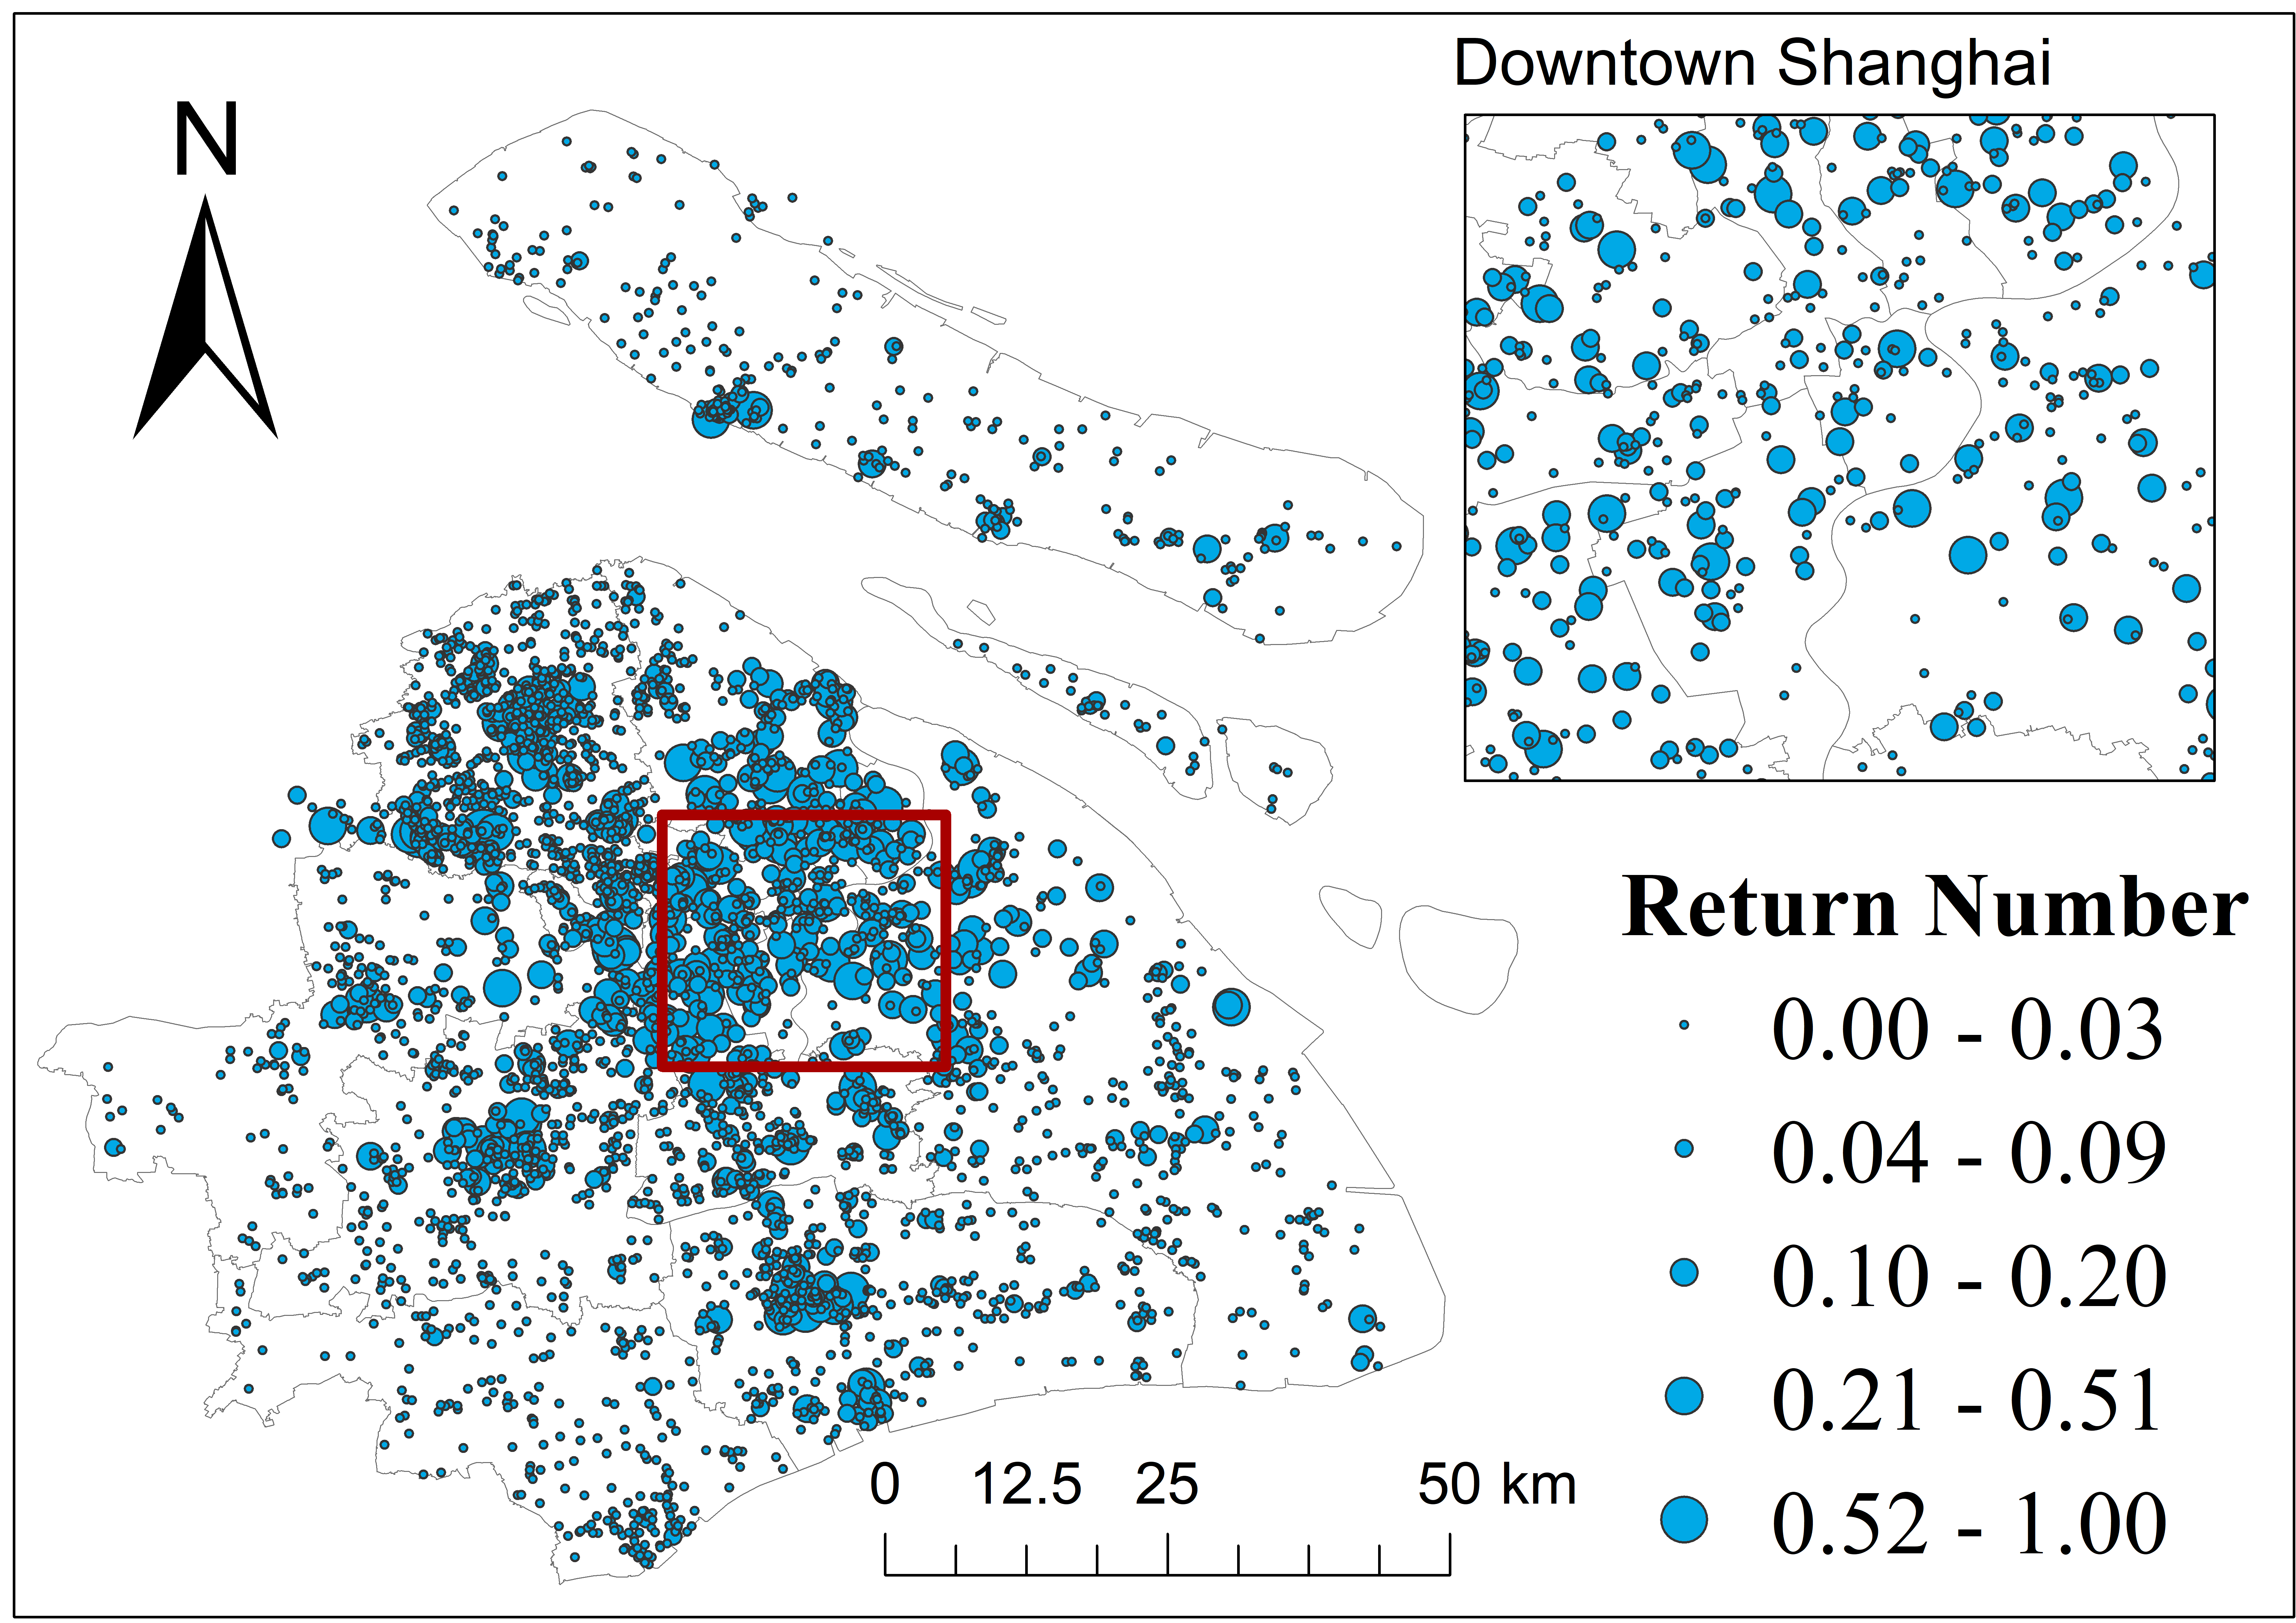
We use computer vision to estimate emissions for each vehicle in traffic camera video. A 2.2-million-image dataset classifies 4,923 car models, and an enhanced COPERT formula adds vehicle speed and acceleration recovered by tracking.
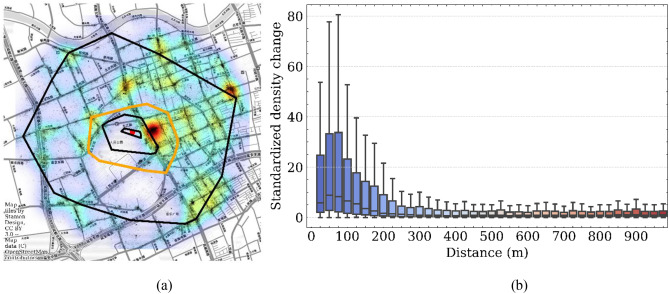
A city-scale traffic emission framework that fuses camera videos with phone location data. By inferring the timing of every traffic signal, we show that real stop-and-go cycles raise PM and NOx emissions 40 to 60 percent above standard methods.
A Digital Twin platform that estimates and forecasts road traffic emissions in near real time. By combining open repositories with IoT sensors, it lets users test alternative policy scenarios. Demonstrated for Kista, Stockholm with a 3D interactive interface.
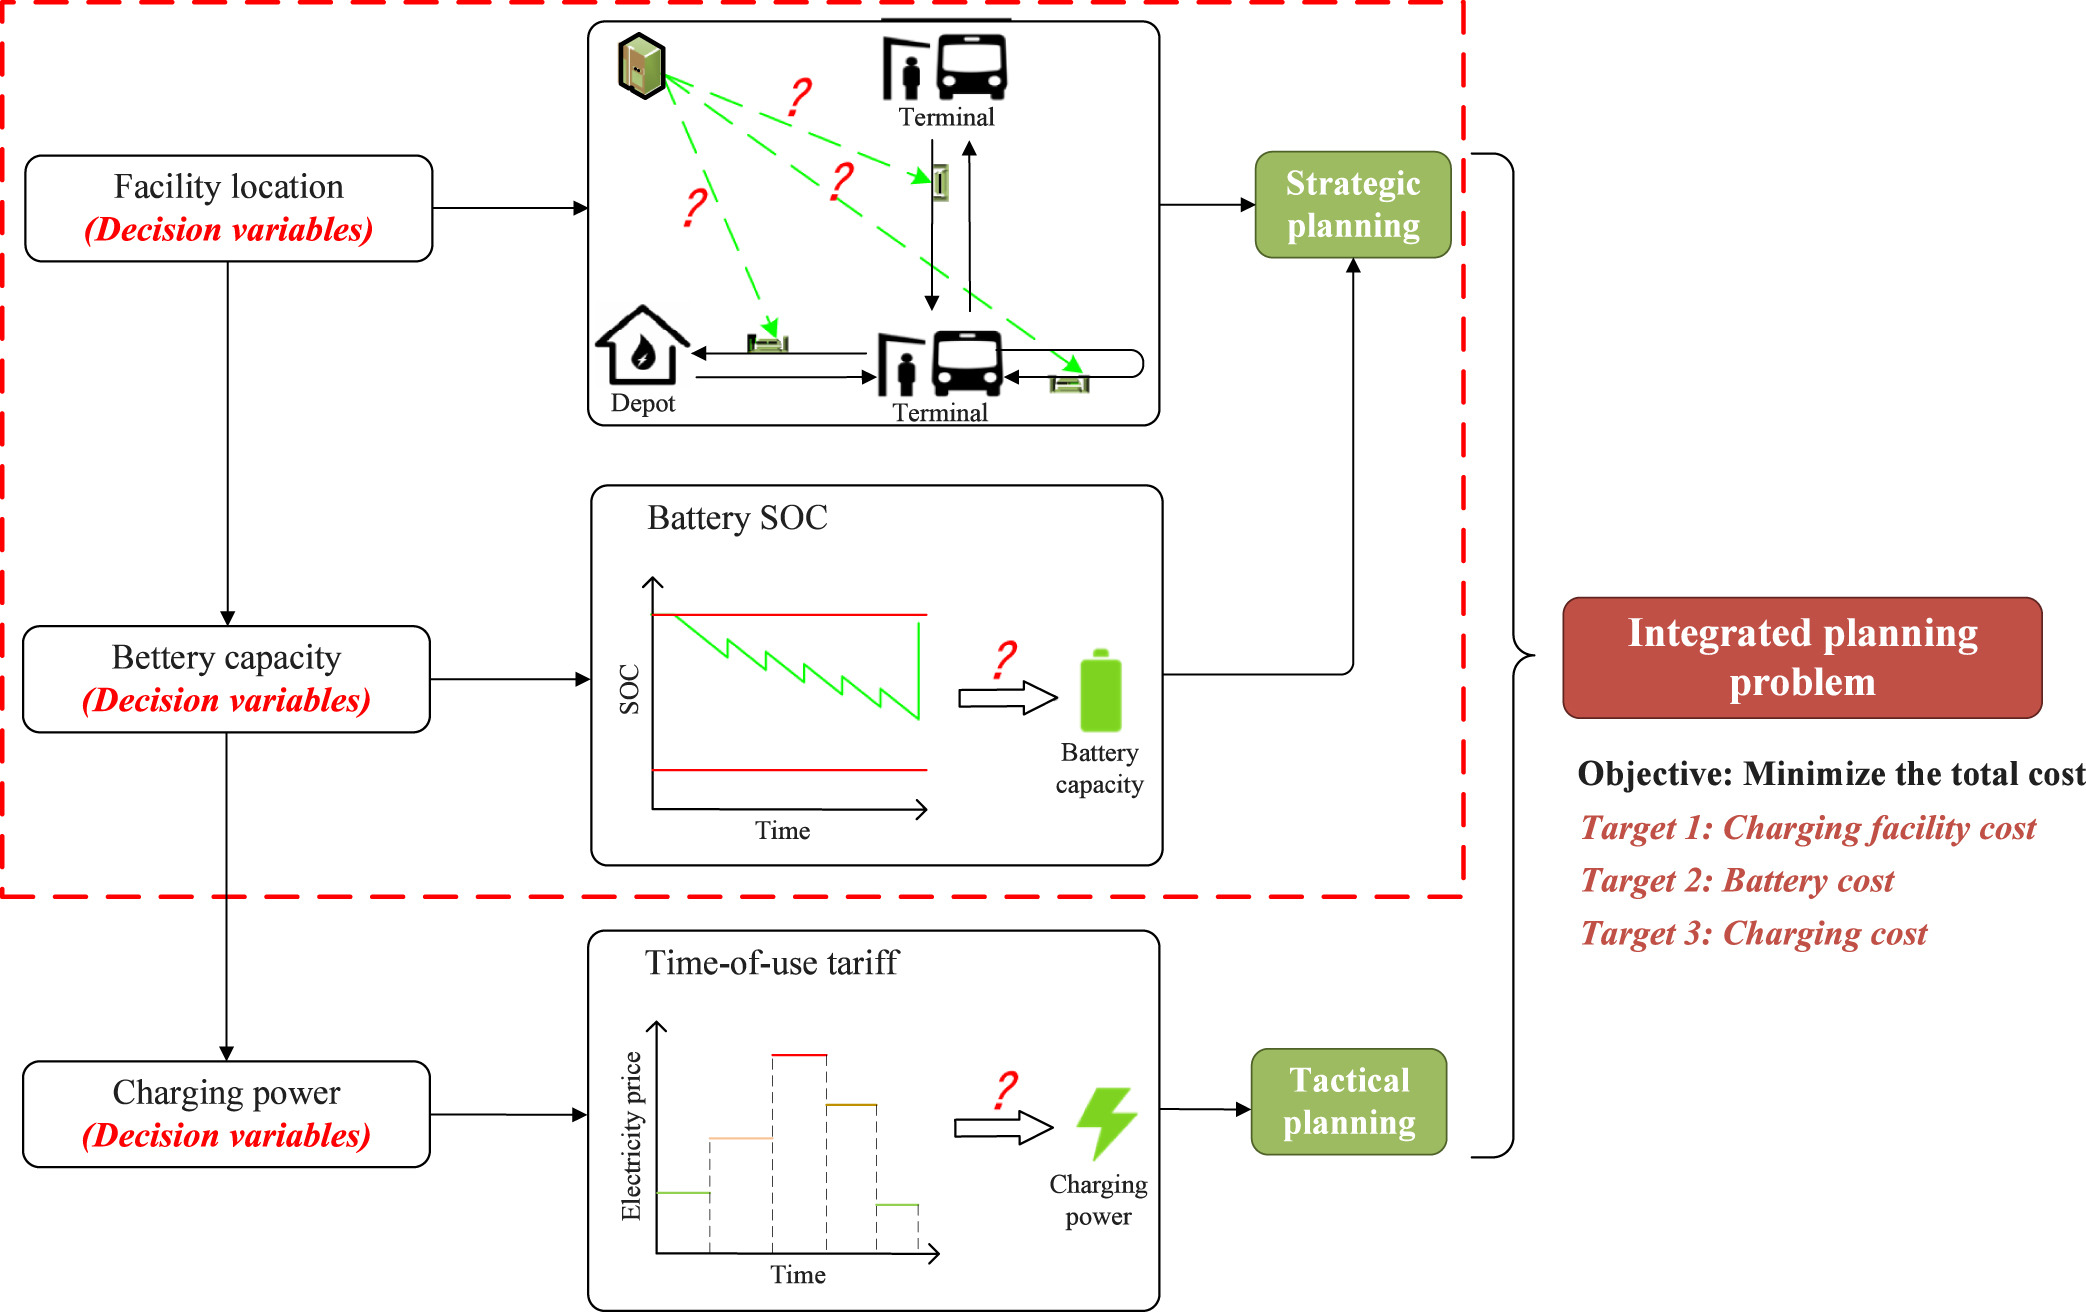
A two-level optimization for electric buses with dynamic wireless charging. The upper level decides where to put charging facilities and how big batteries should be; the lower level schedules daily charging under time-of-use electricity prices.
Disasters, pandemics, and extreme weather profoundly disrupt how people travel. My work measures travel patterns before, during, and after such events, with a particular focus on which underserved communities recover the slowest.
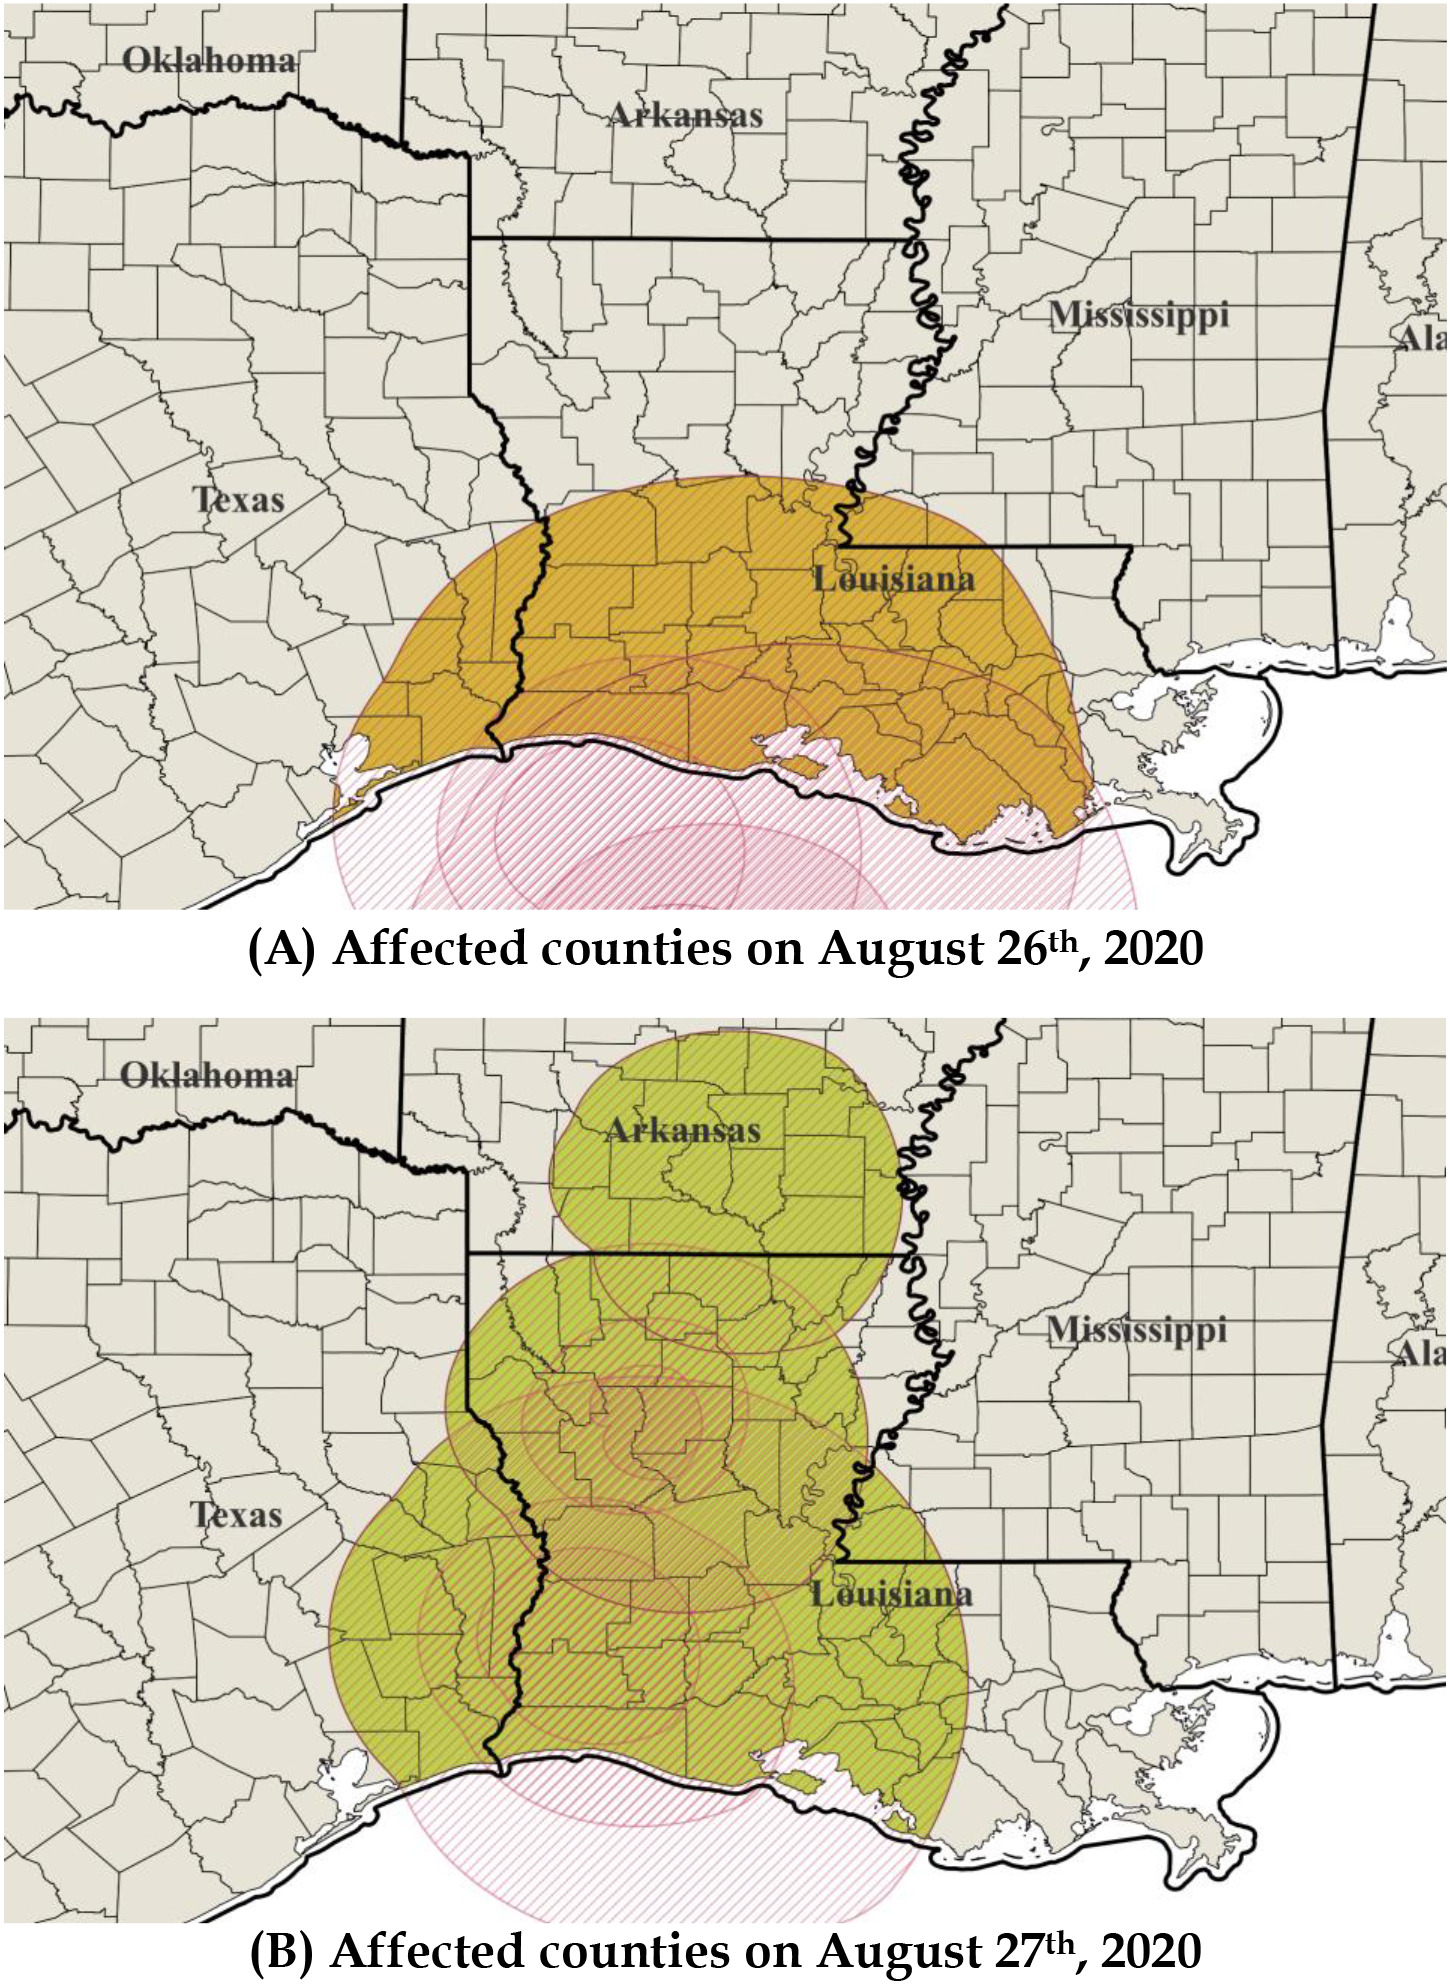
A Hurricane Laura case study: when disasters and pandemics overlap, evacuation flows reshape mobility and spread COVID-19 across counties. Disadvantaged communities face both higher exposure and slower recovery.
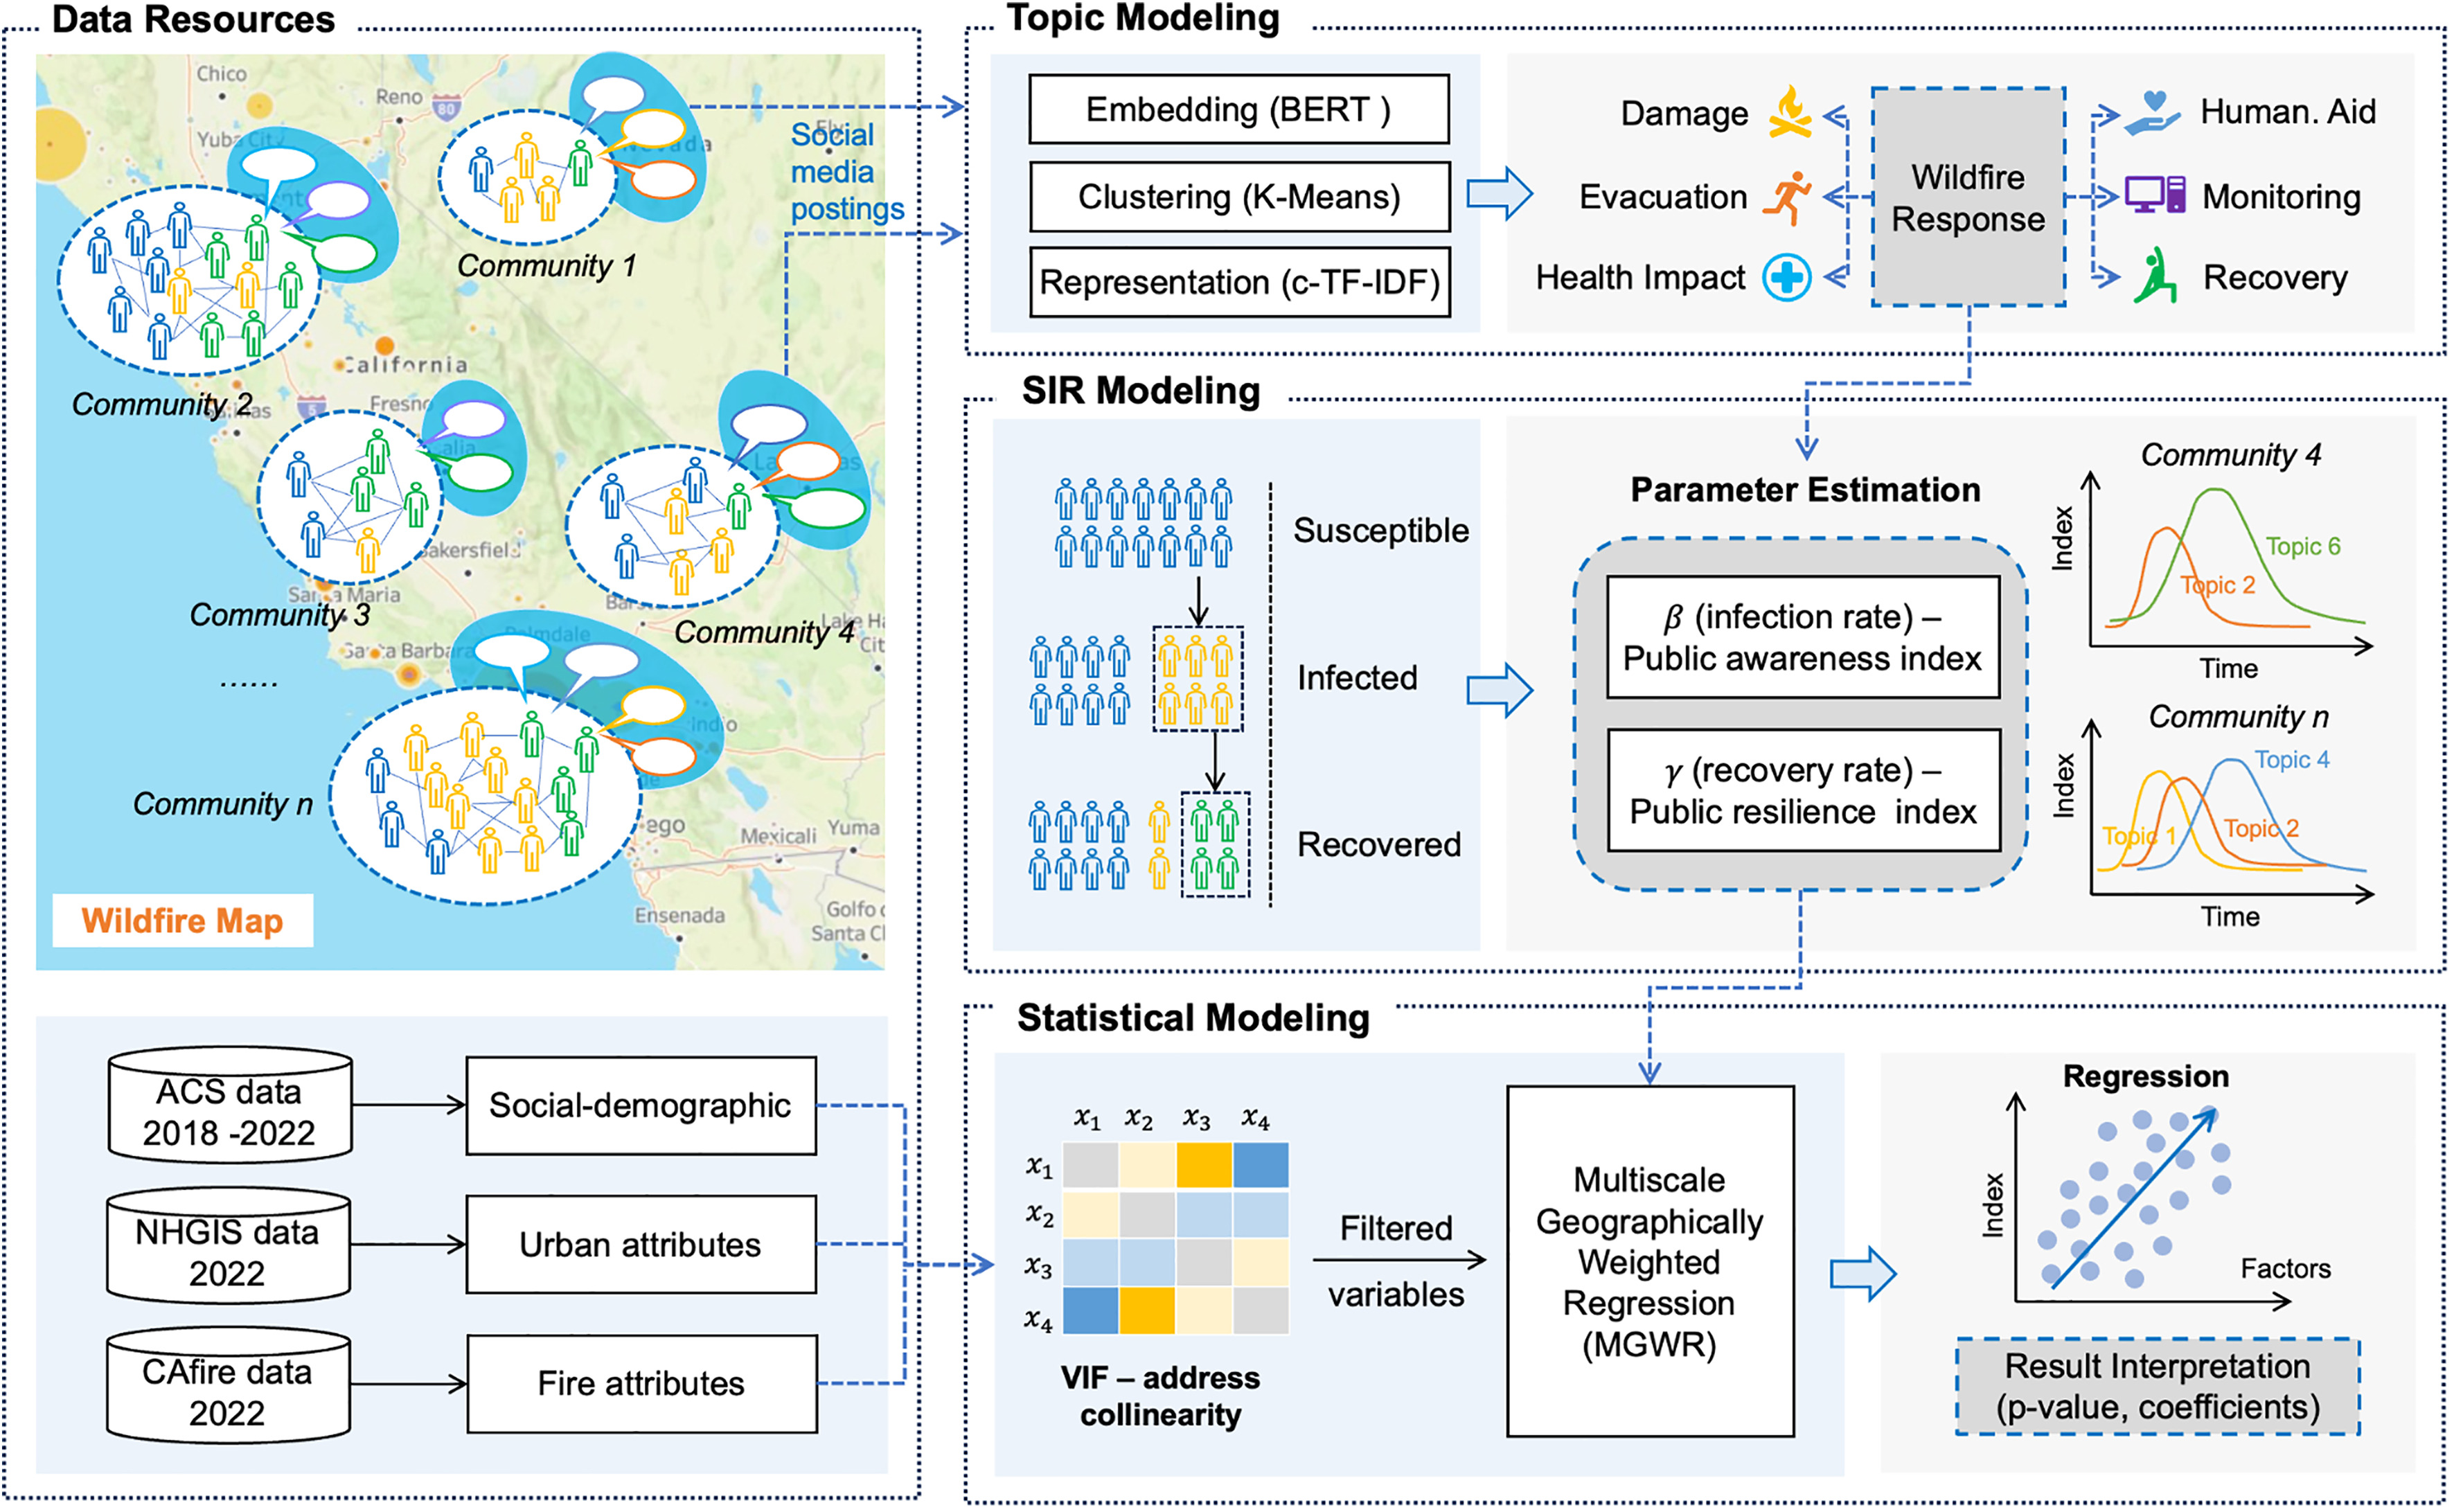
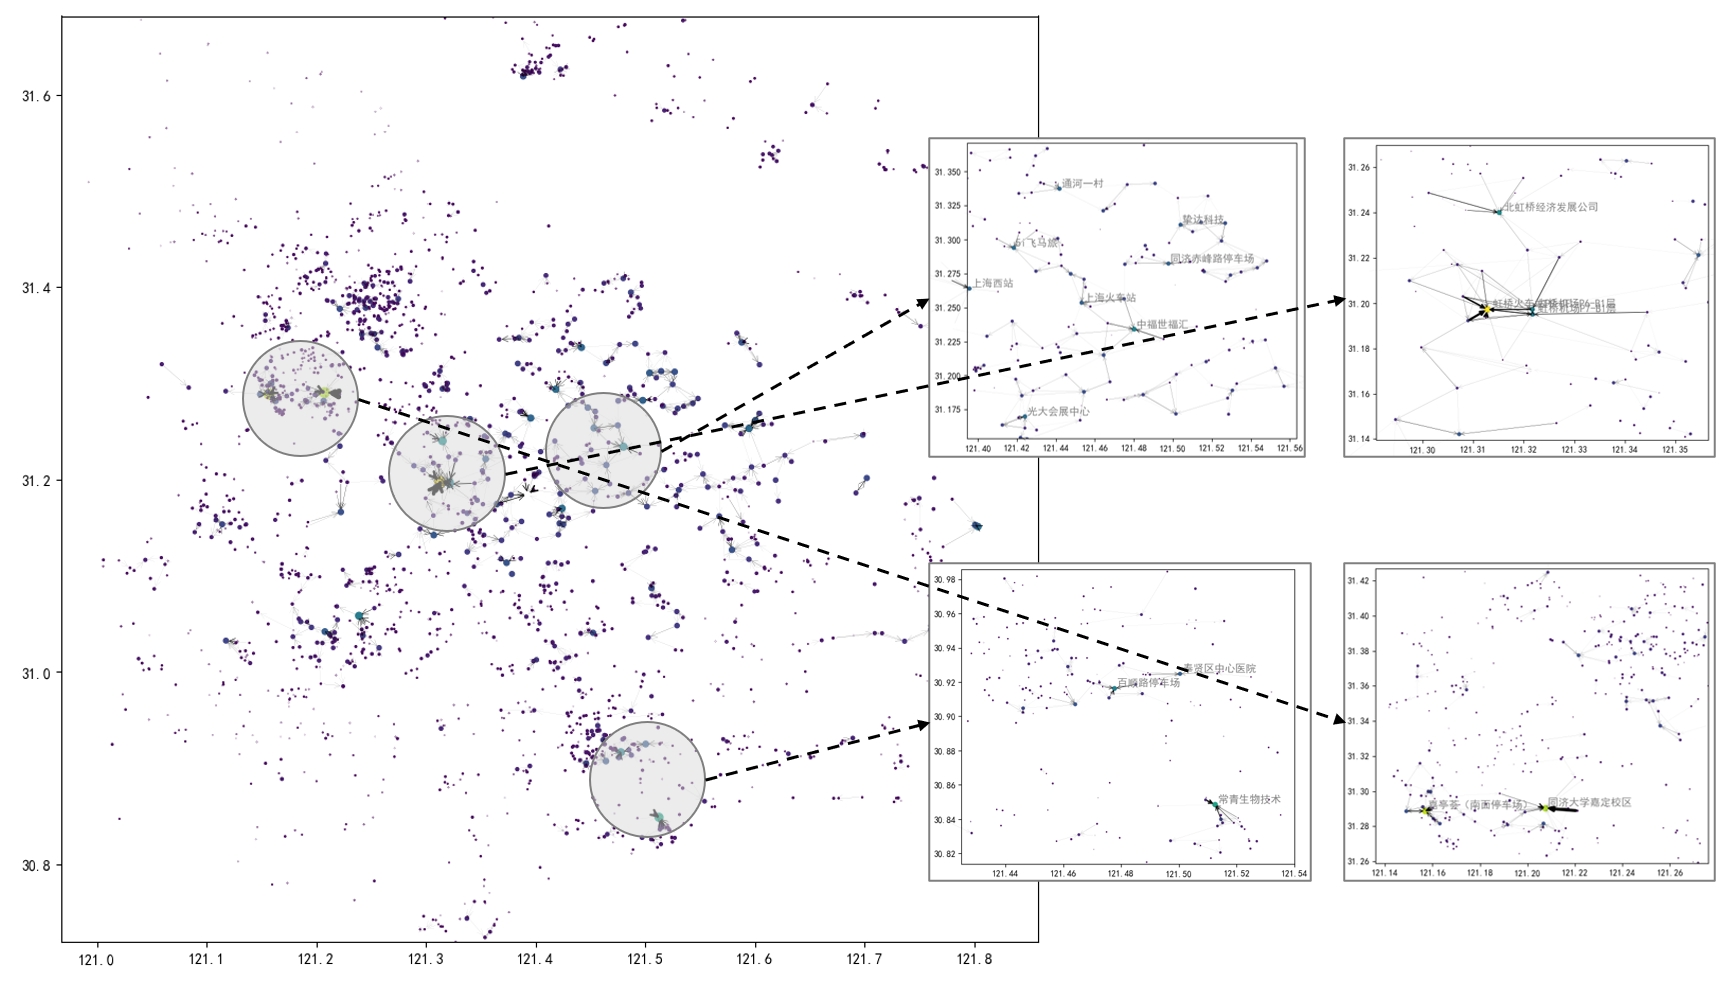
We combine SIR-style diffusion models with NLP on social media to study how the US public responds to wildfires. The model captures how concern spreads across regions and which socioeconomic factors shape community reactions.
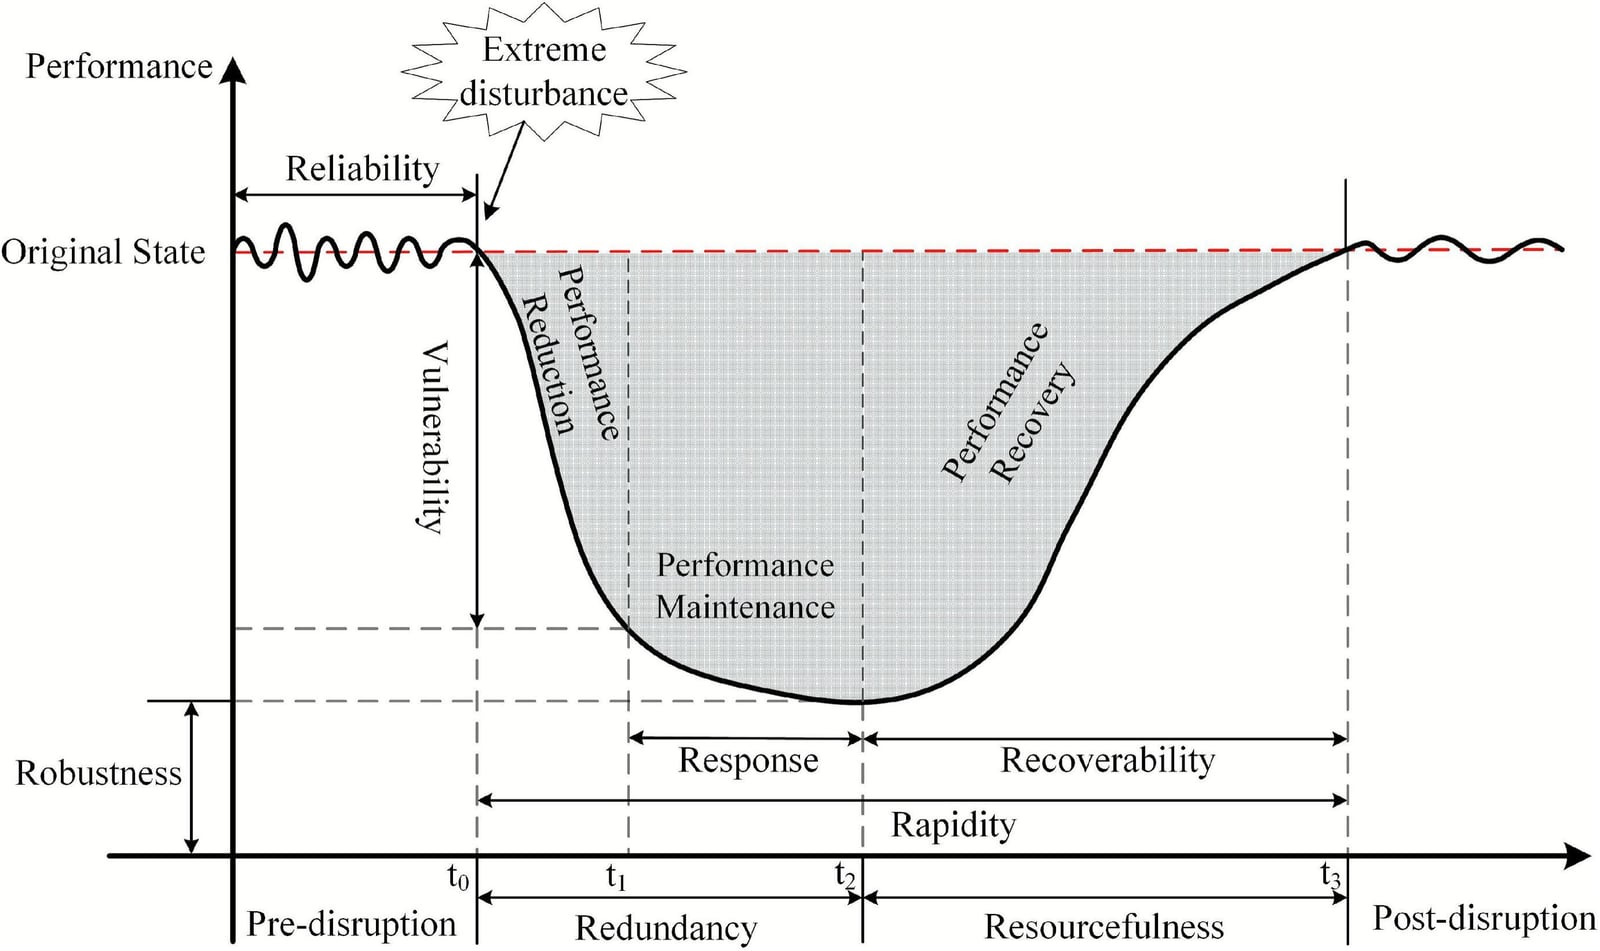
A comprehensive review of how to model, measure, and optimize the resilience of multi-modal urban transport networks (road, transit, shared mobility), with a look ahead at next-generation infrastructure.
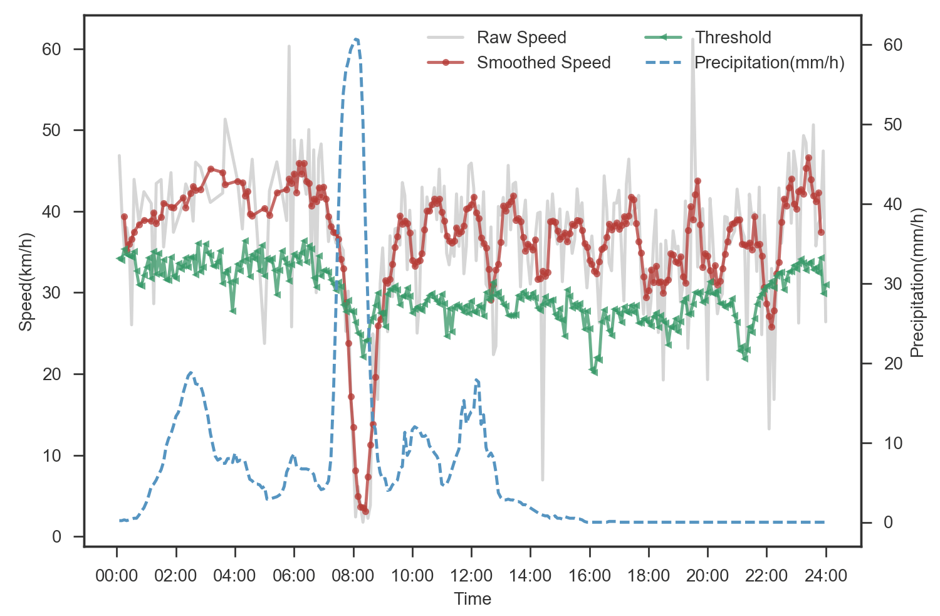
We compare passive phone data with active Waze reports for tracking how extreme weather affects road traffic. Active reports underestimate severity because fewer users go outside as conditions worsen, and they stop reporting.
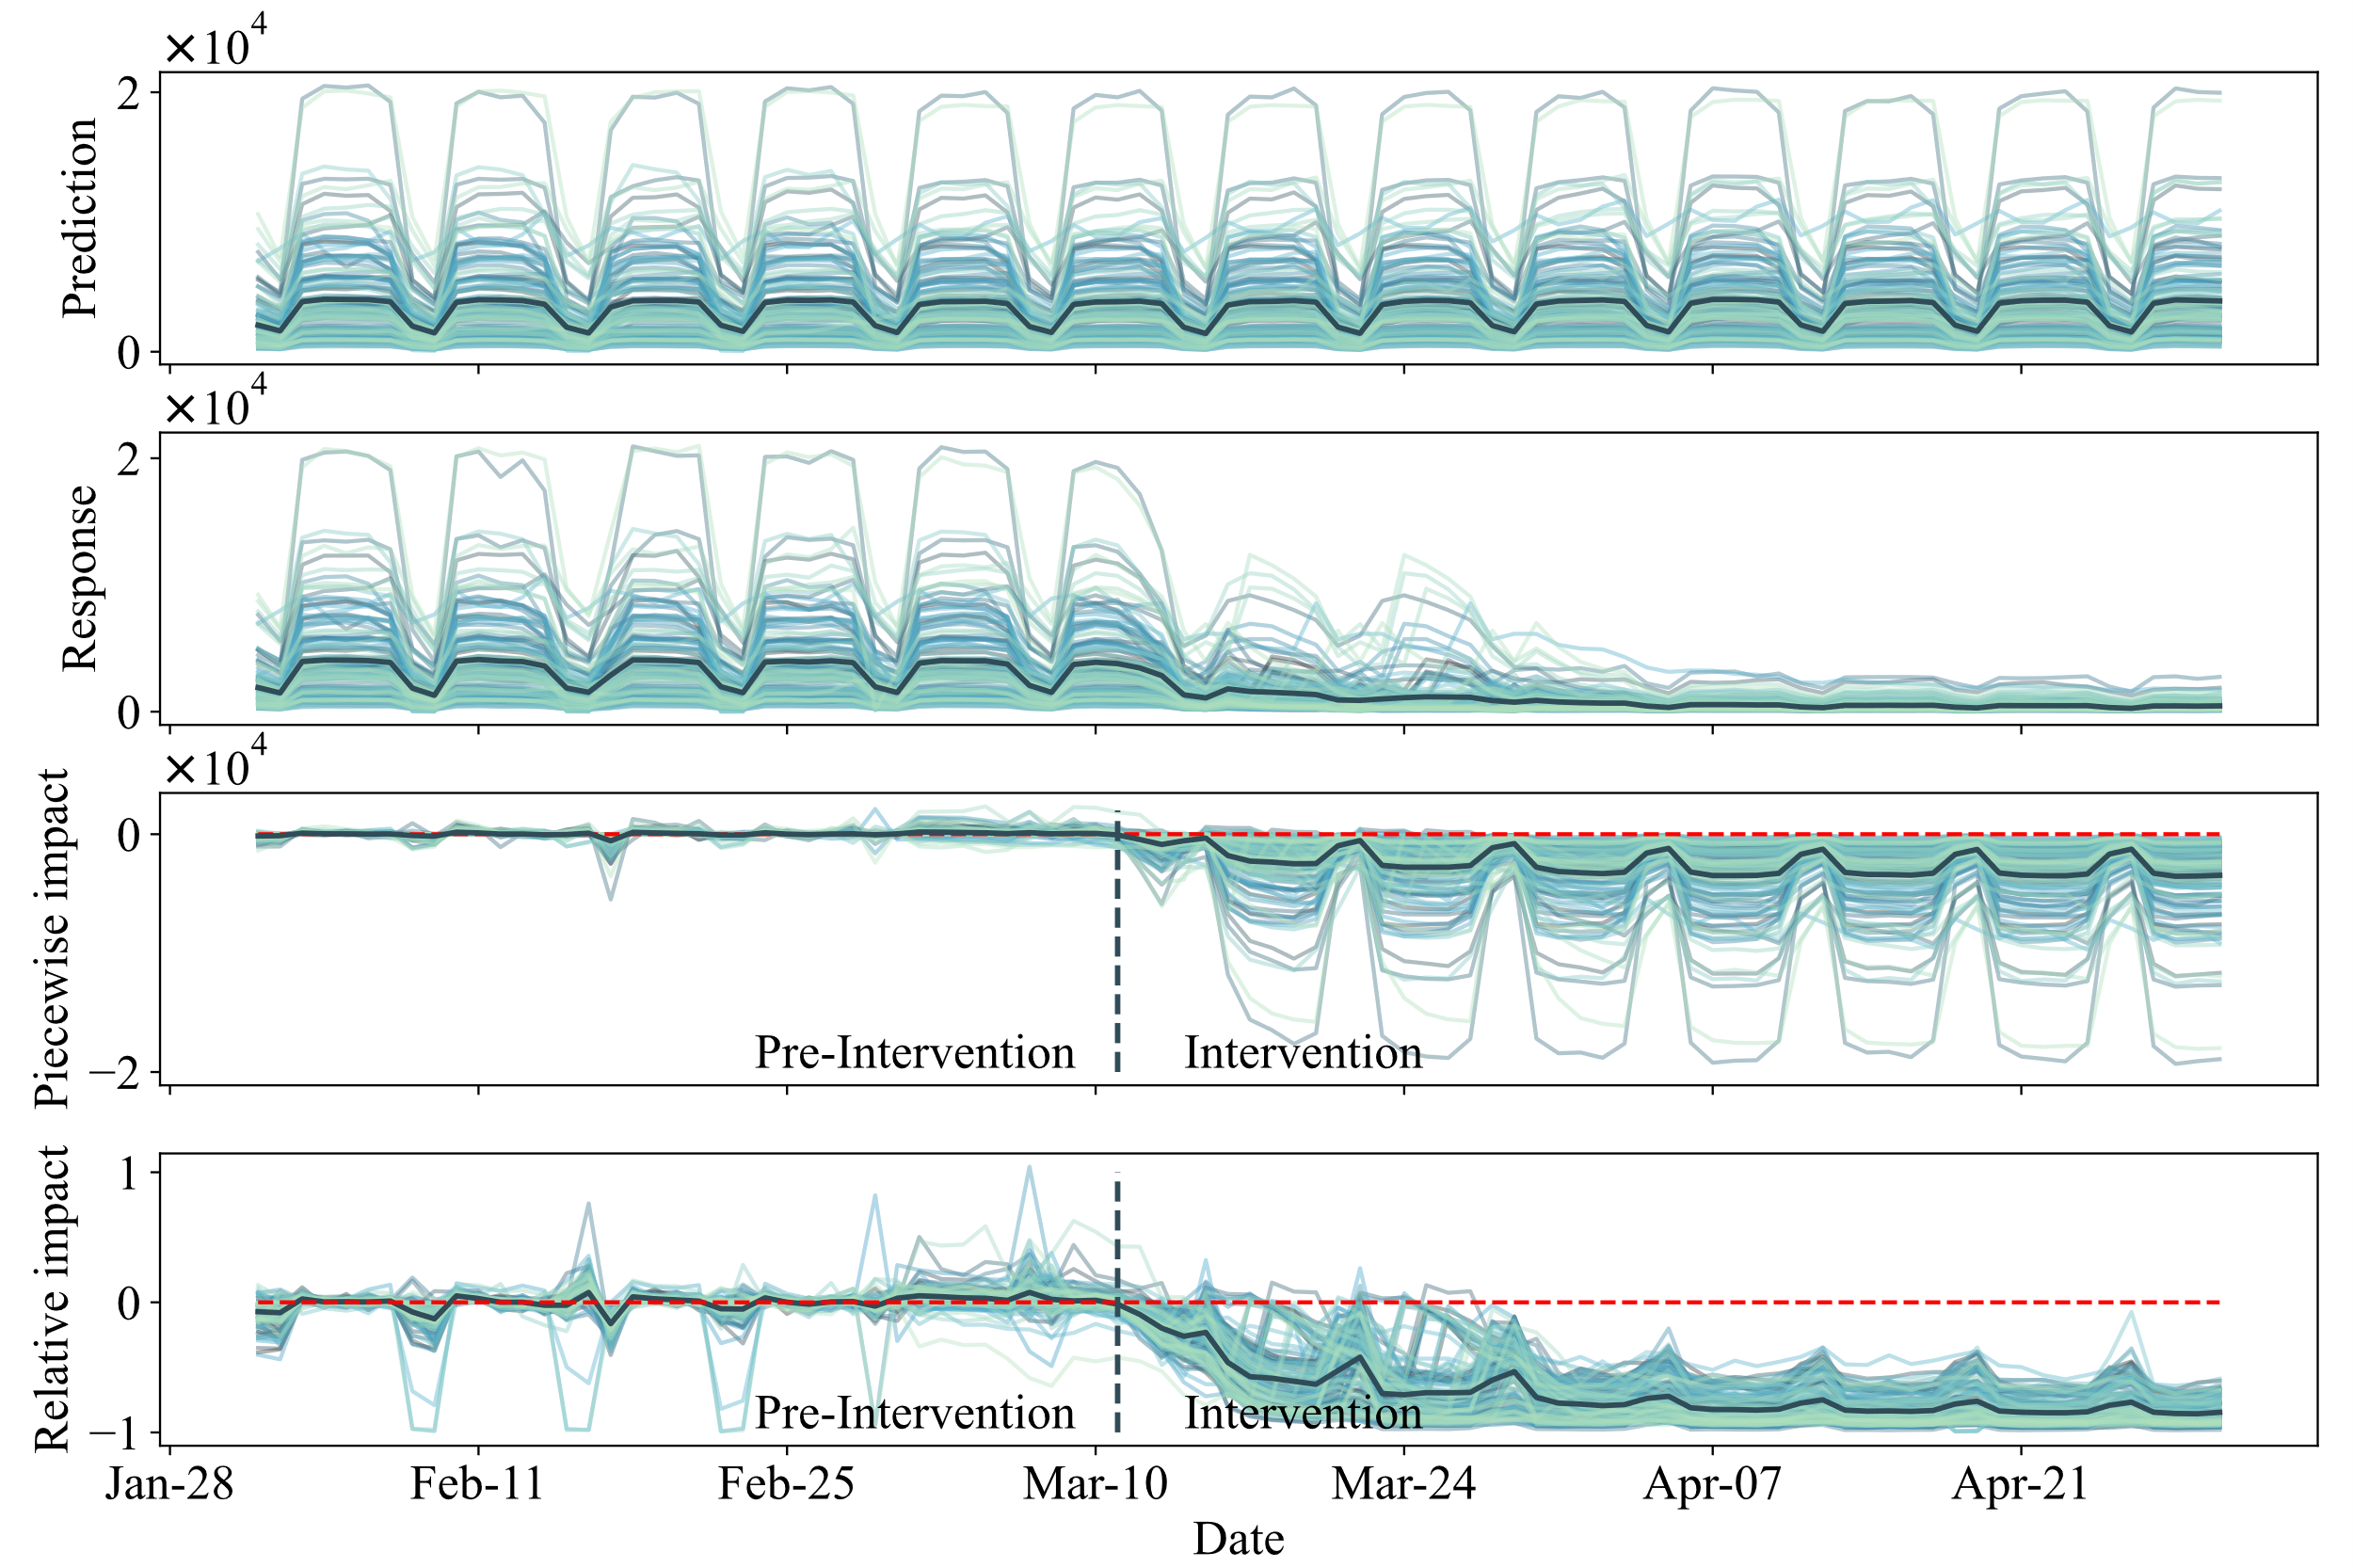
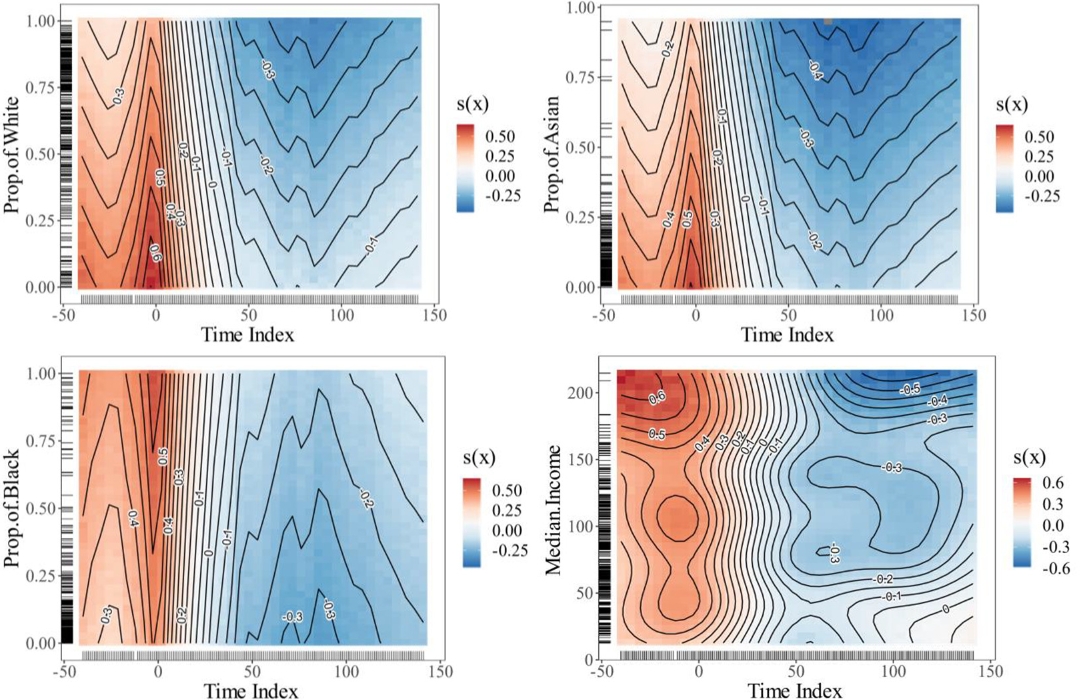
Twenty years of Chicago transit ridership analyzed with Bayesian time series. After controlling for socioeconomic factors, the pandemic-driven decline was sharpest in commercial areas and in white, educated, high-income neighborhoods.
We track Chicago bikesharing across the pandemic and compare it with transit, driving, and walking. Bikesharing is the most resilient mode, but high-income station areas saw the largest swings, both up and down.
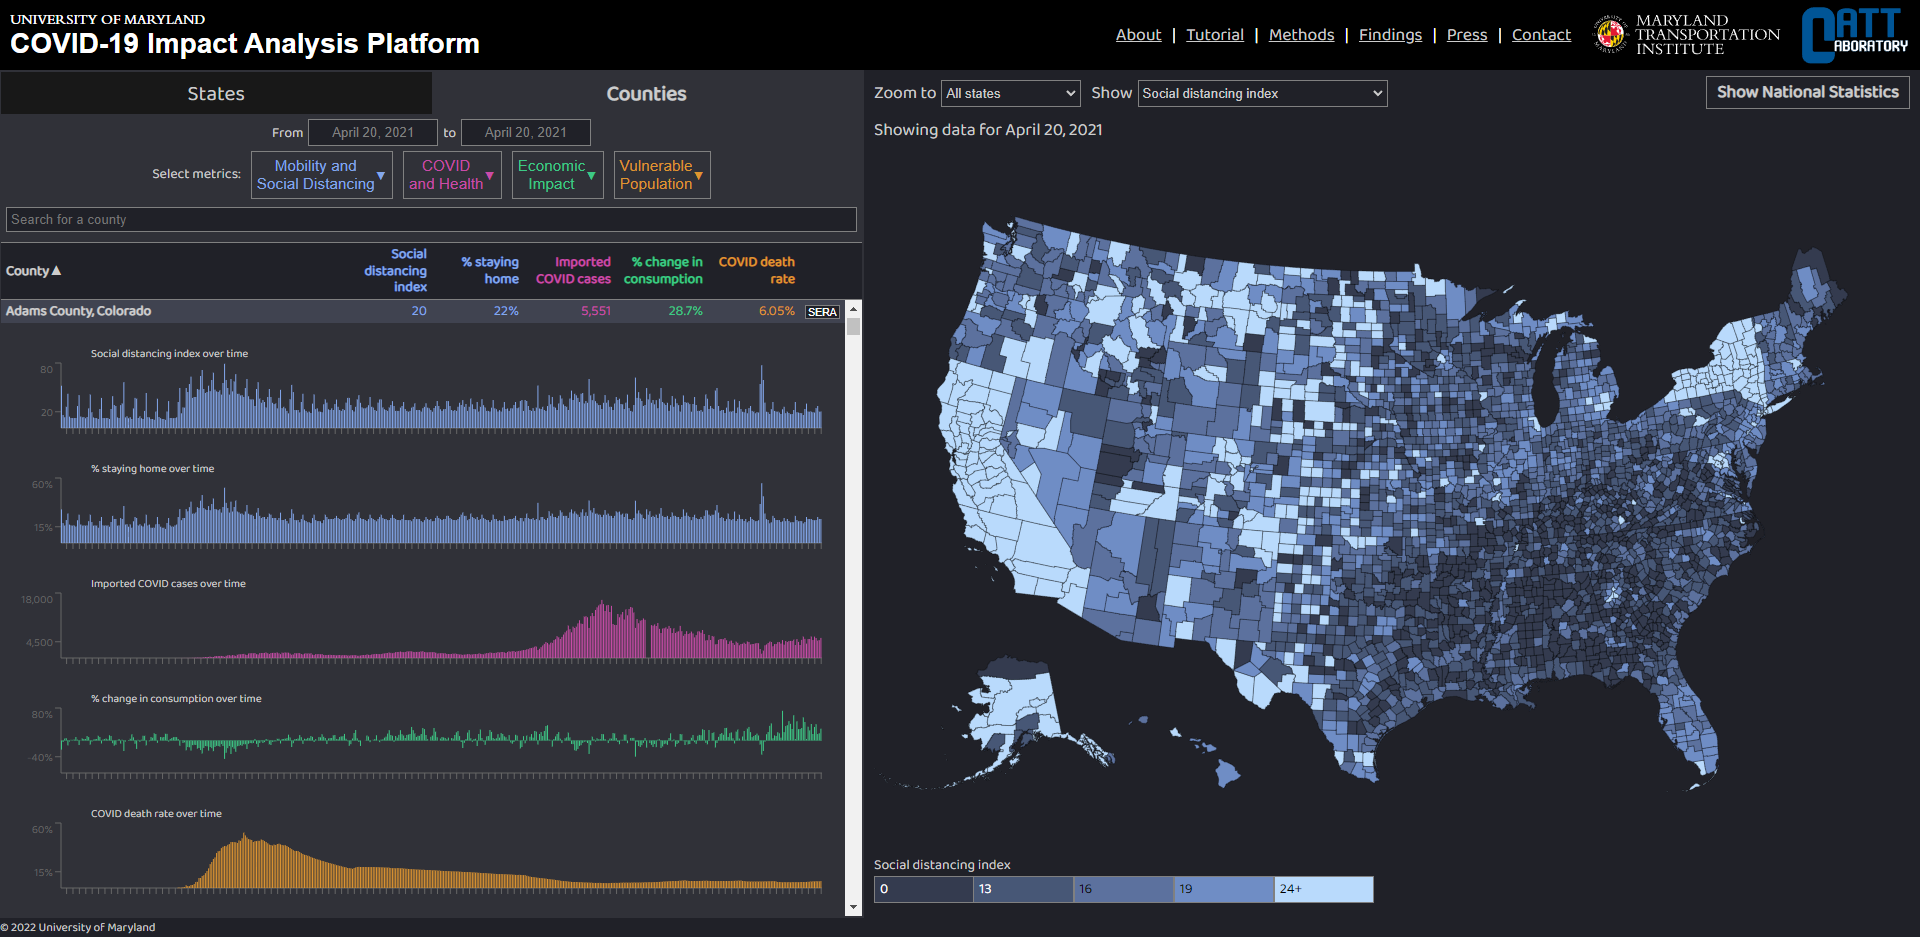
We track pandemic-era US mobility from 150 million phones, summarizing trips per person, person-miles traveled, and share staying home. Daily numbers are public on this platform.
The COVID-19 pandemic showed how tightly human mobility is coupled to disease dynamics. My work combines econometric, epidemiological, and simulation models to disentangle the causal links among mobility, vaccination, public policy, and infection outcomes.
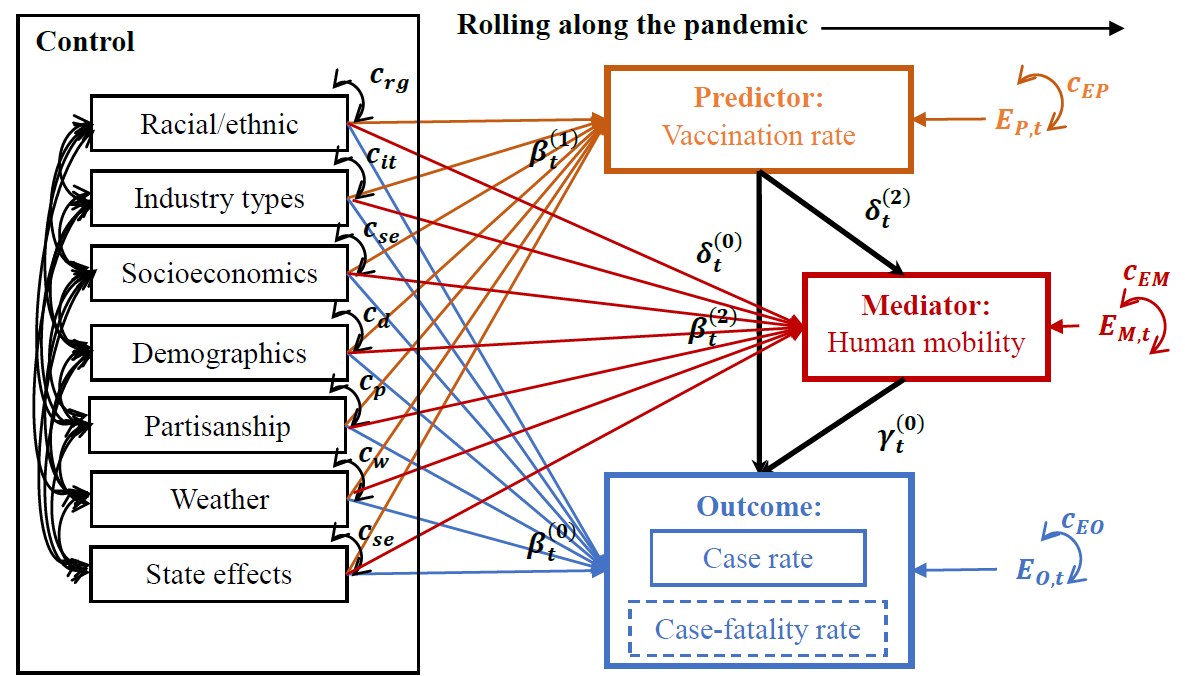
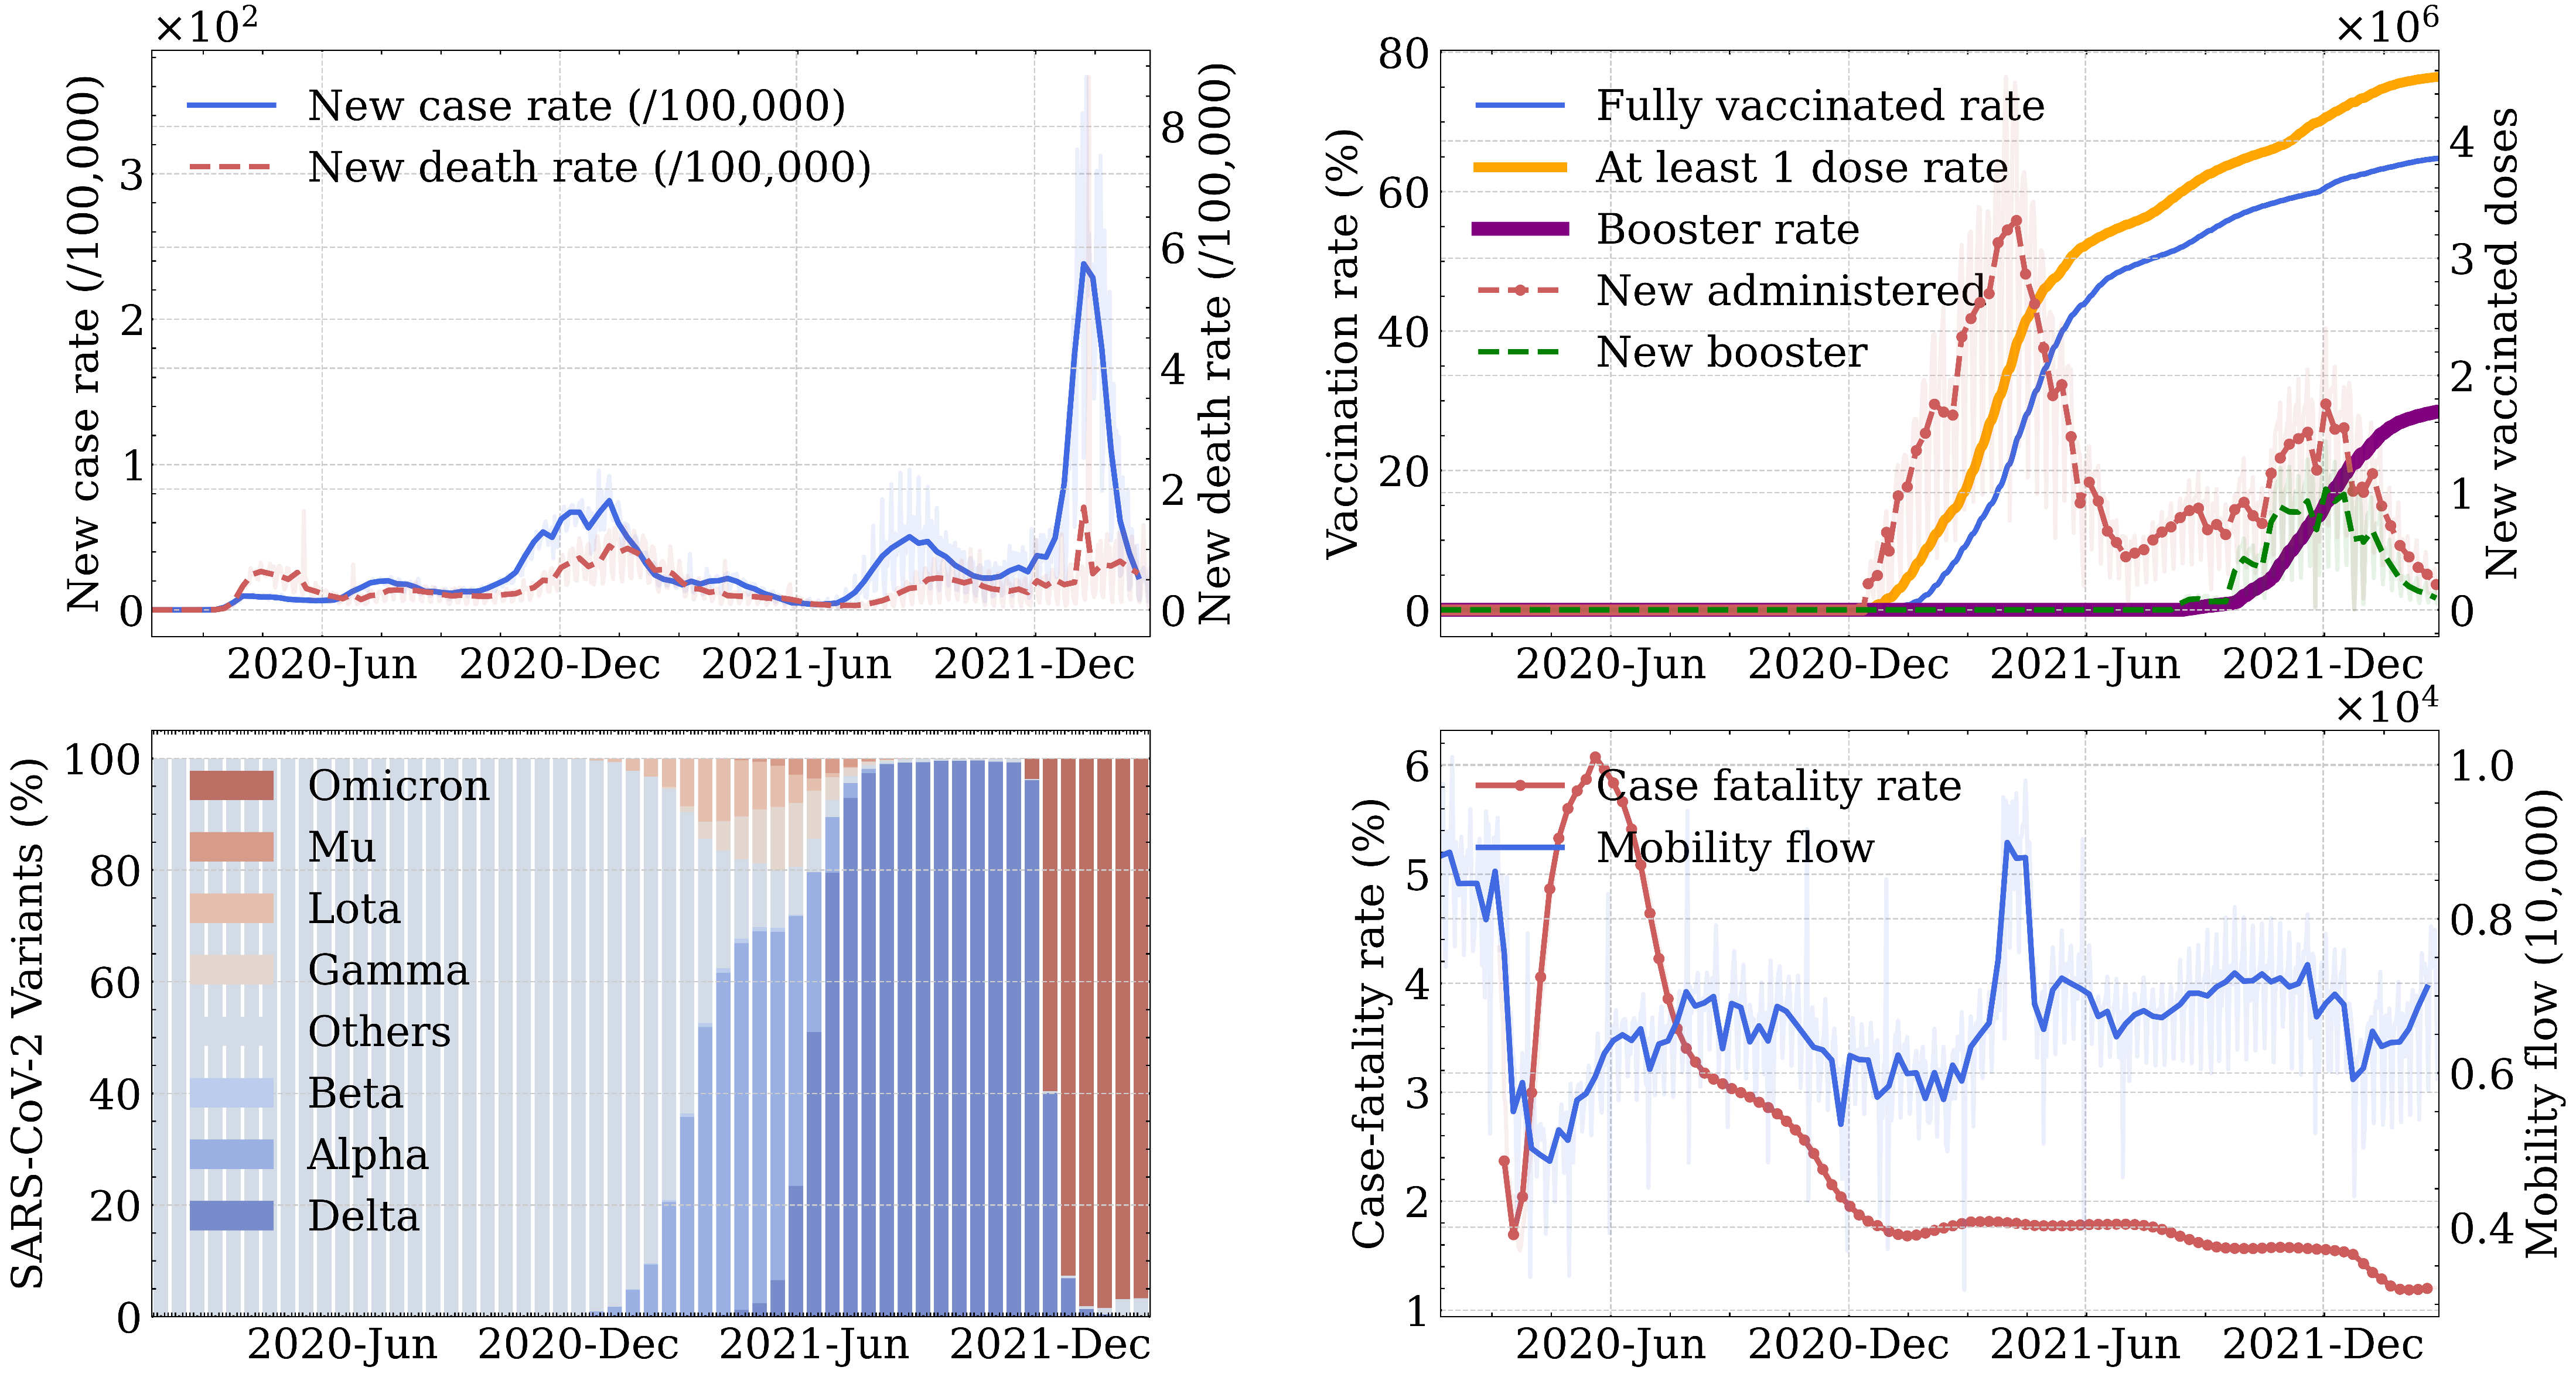
Two years of US county data on vaccines, mobility, and outcomes. During the Omicron wave, vaccines became less effective at preventing cases but kept reducing deaths. An NIH-funded agent-based extension is underway.
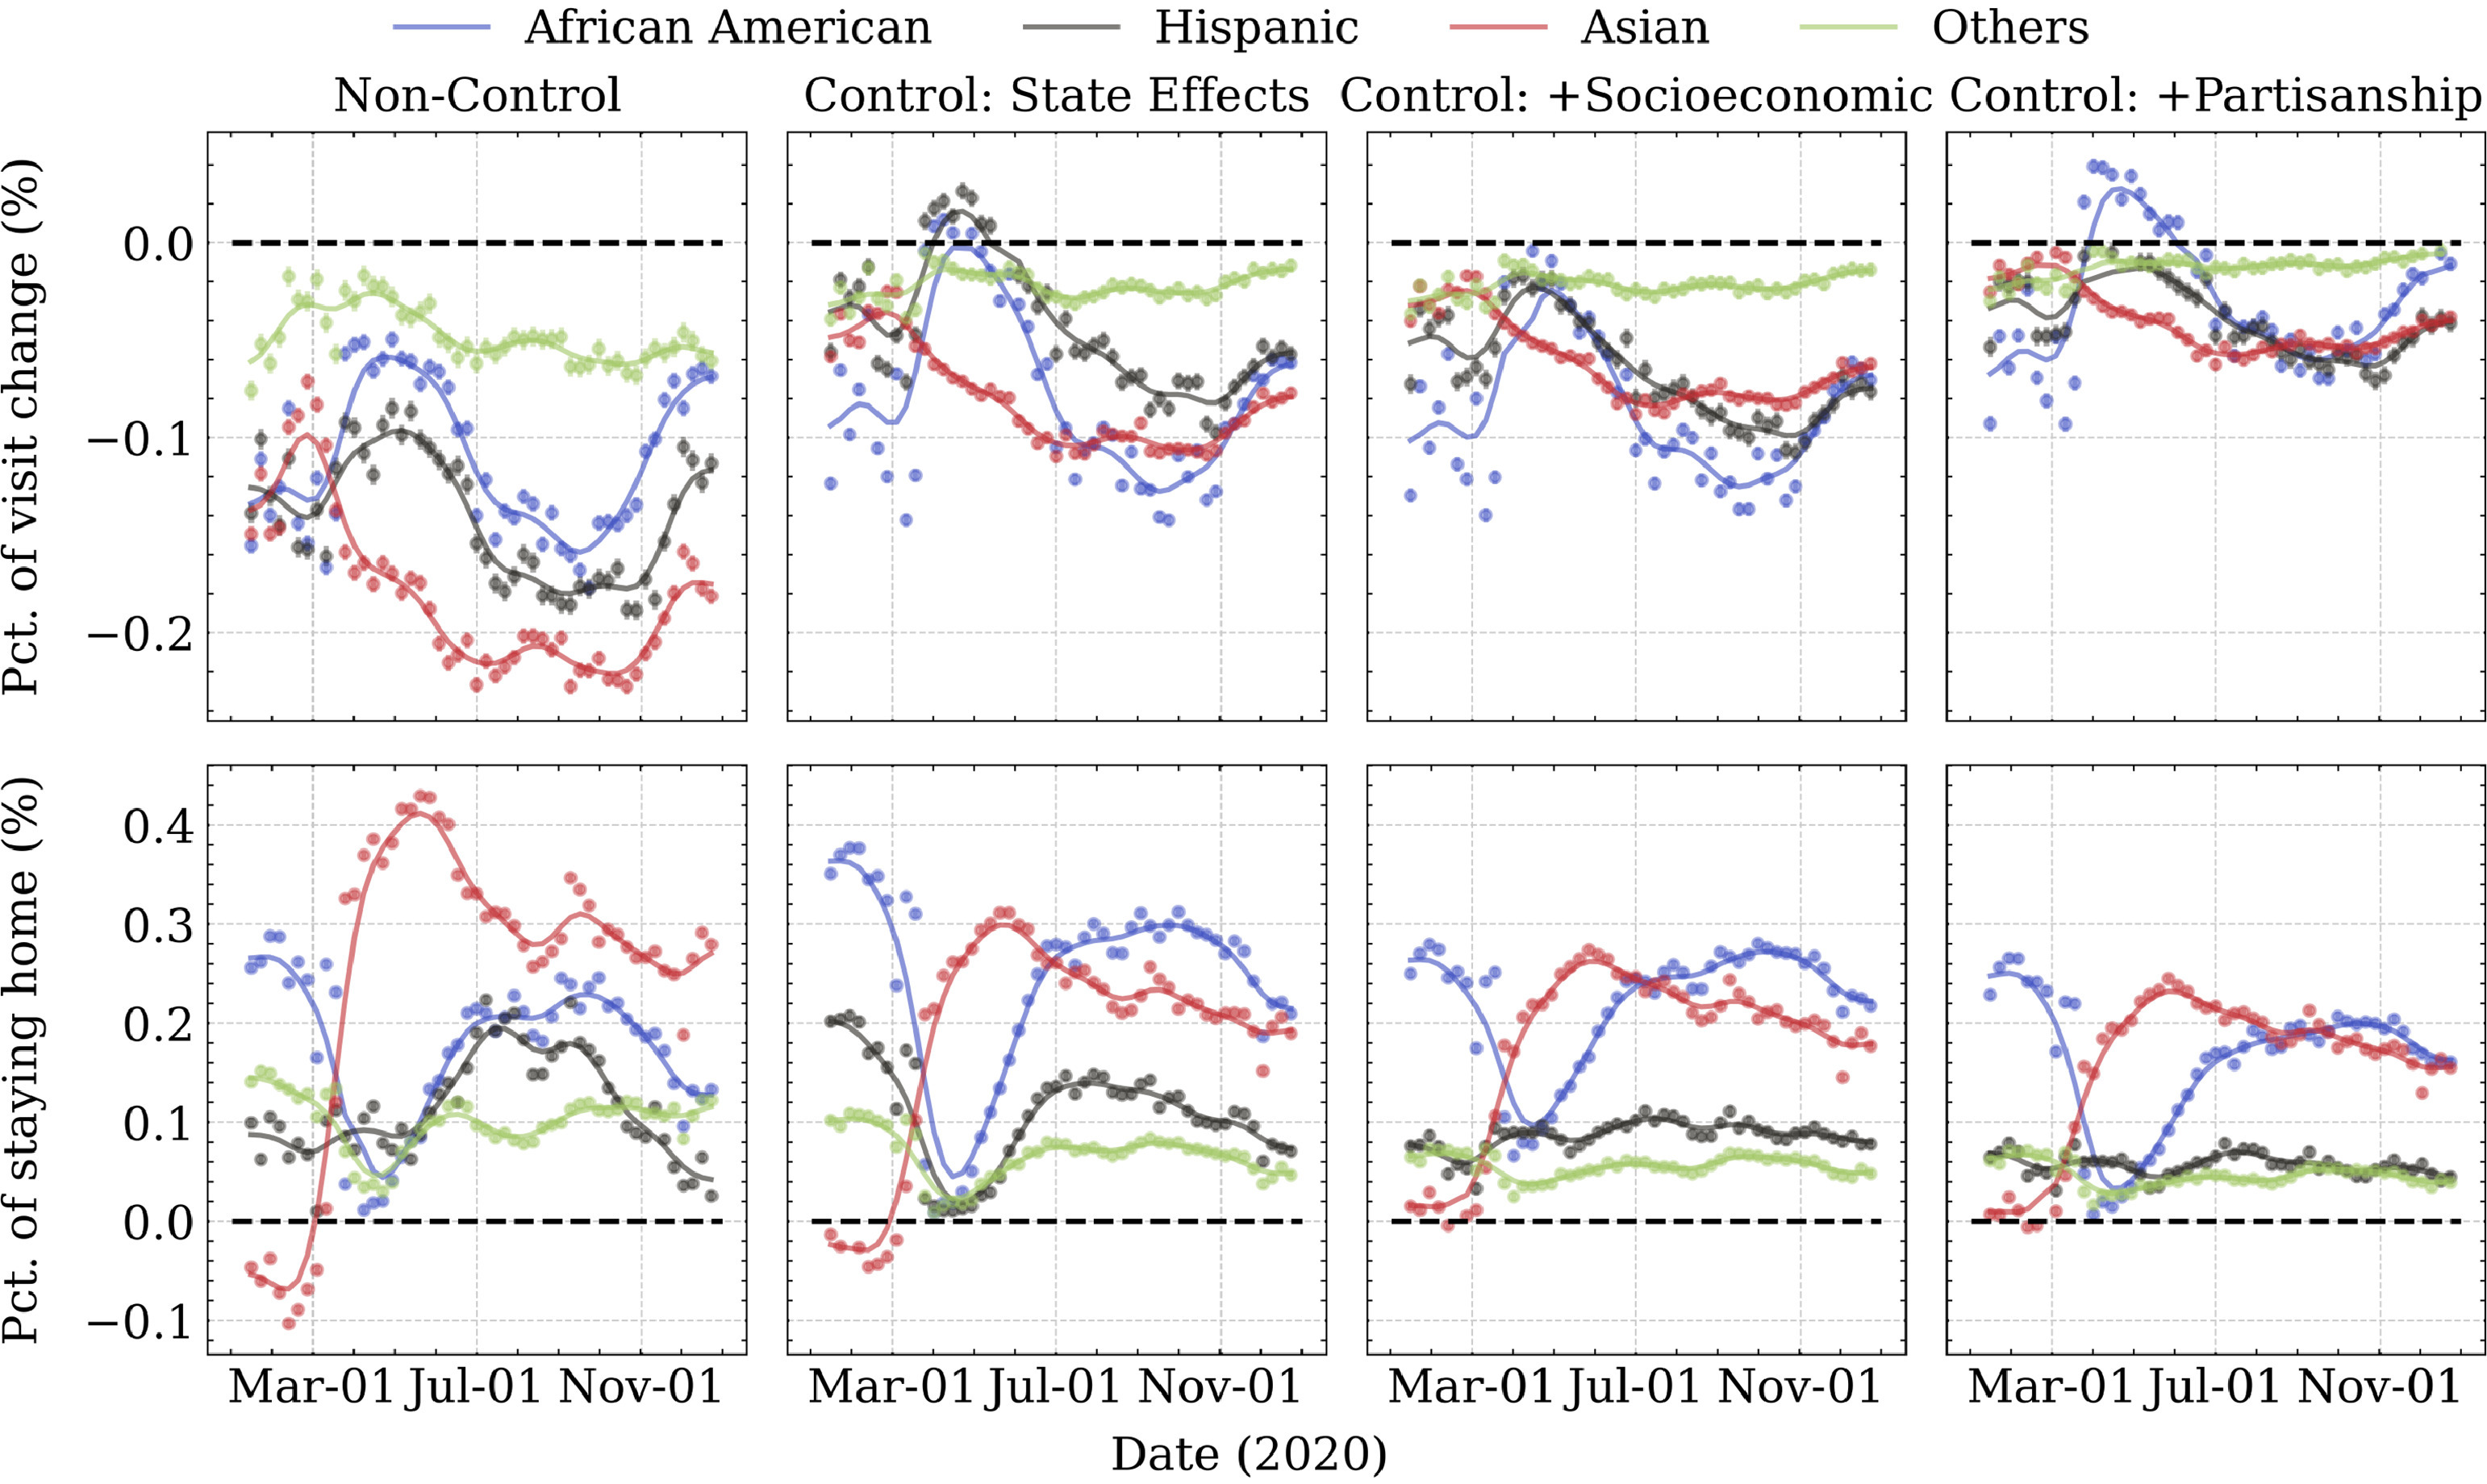
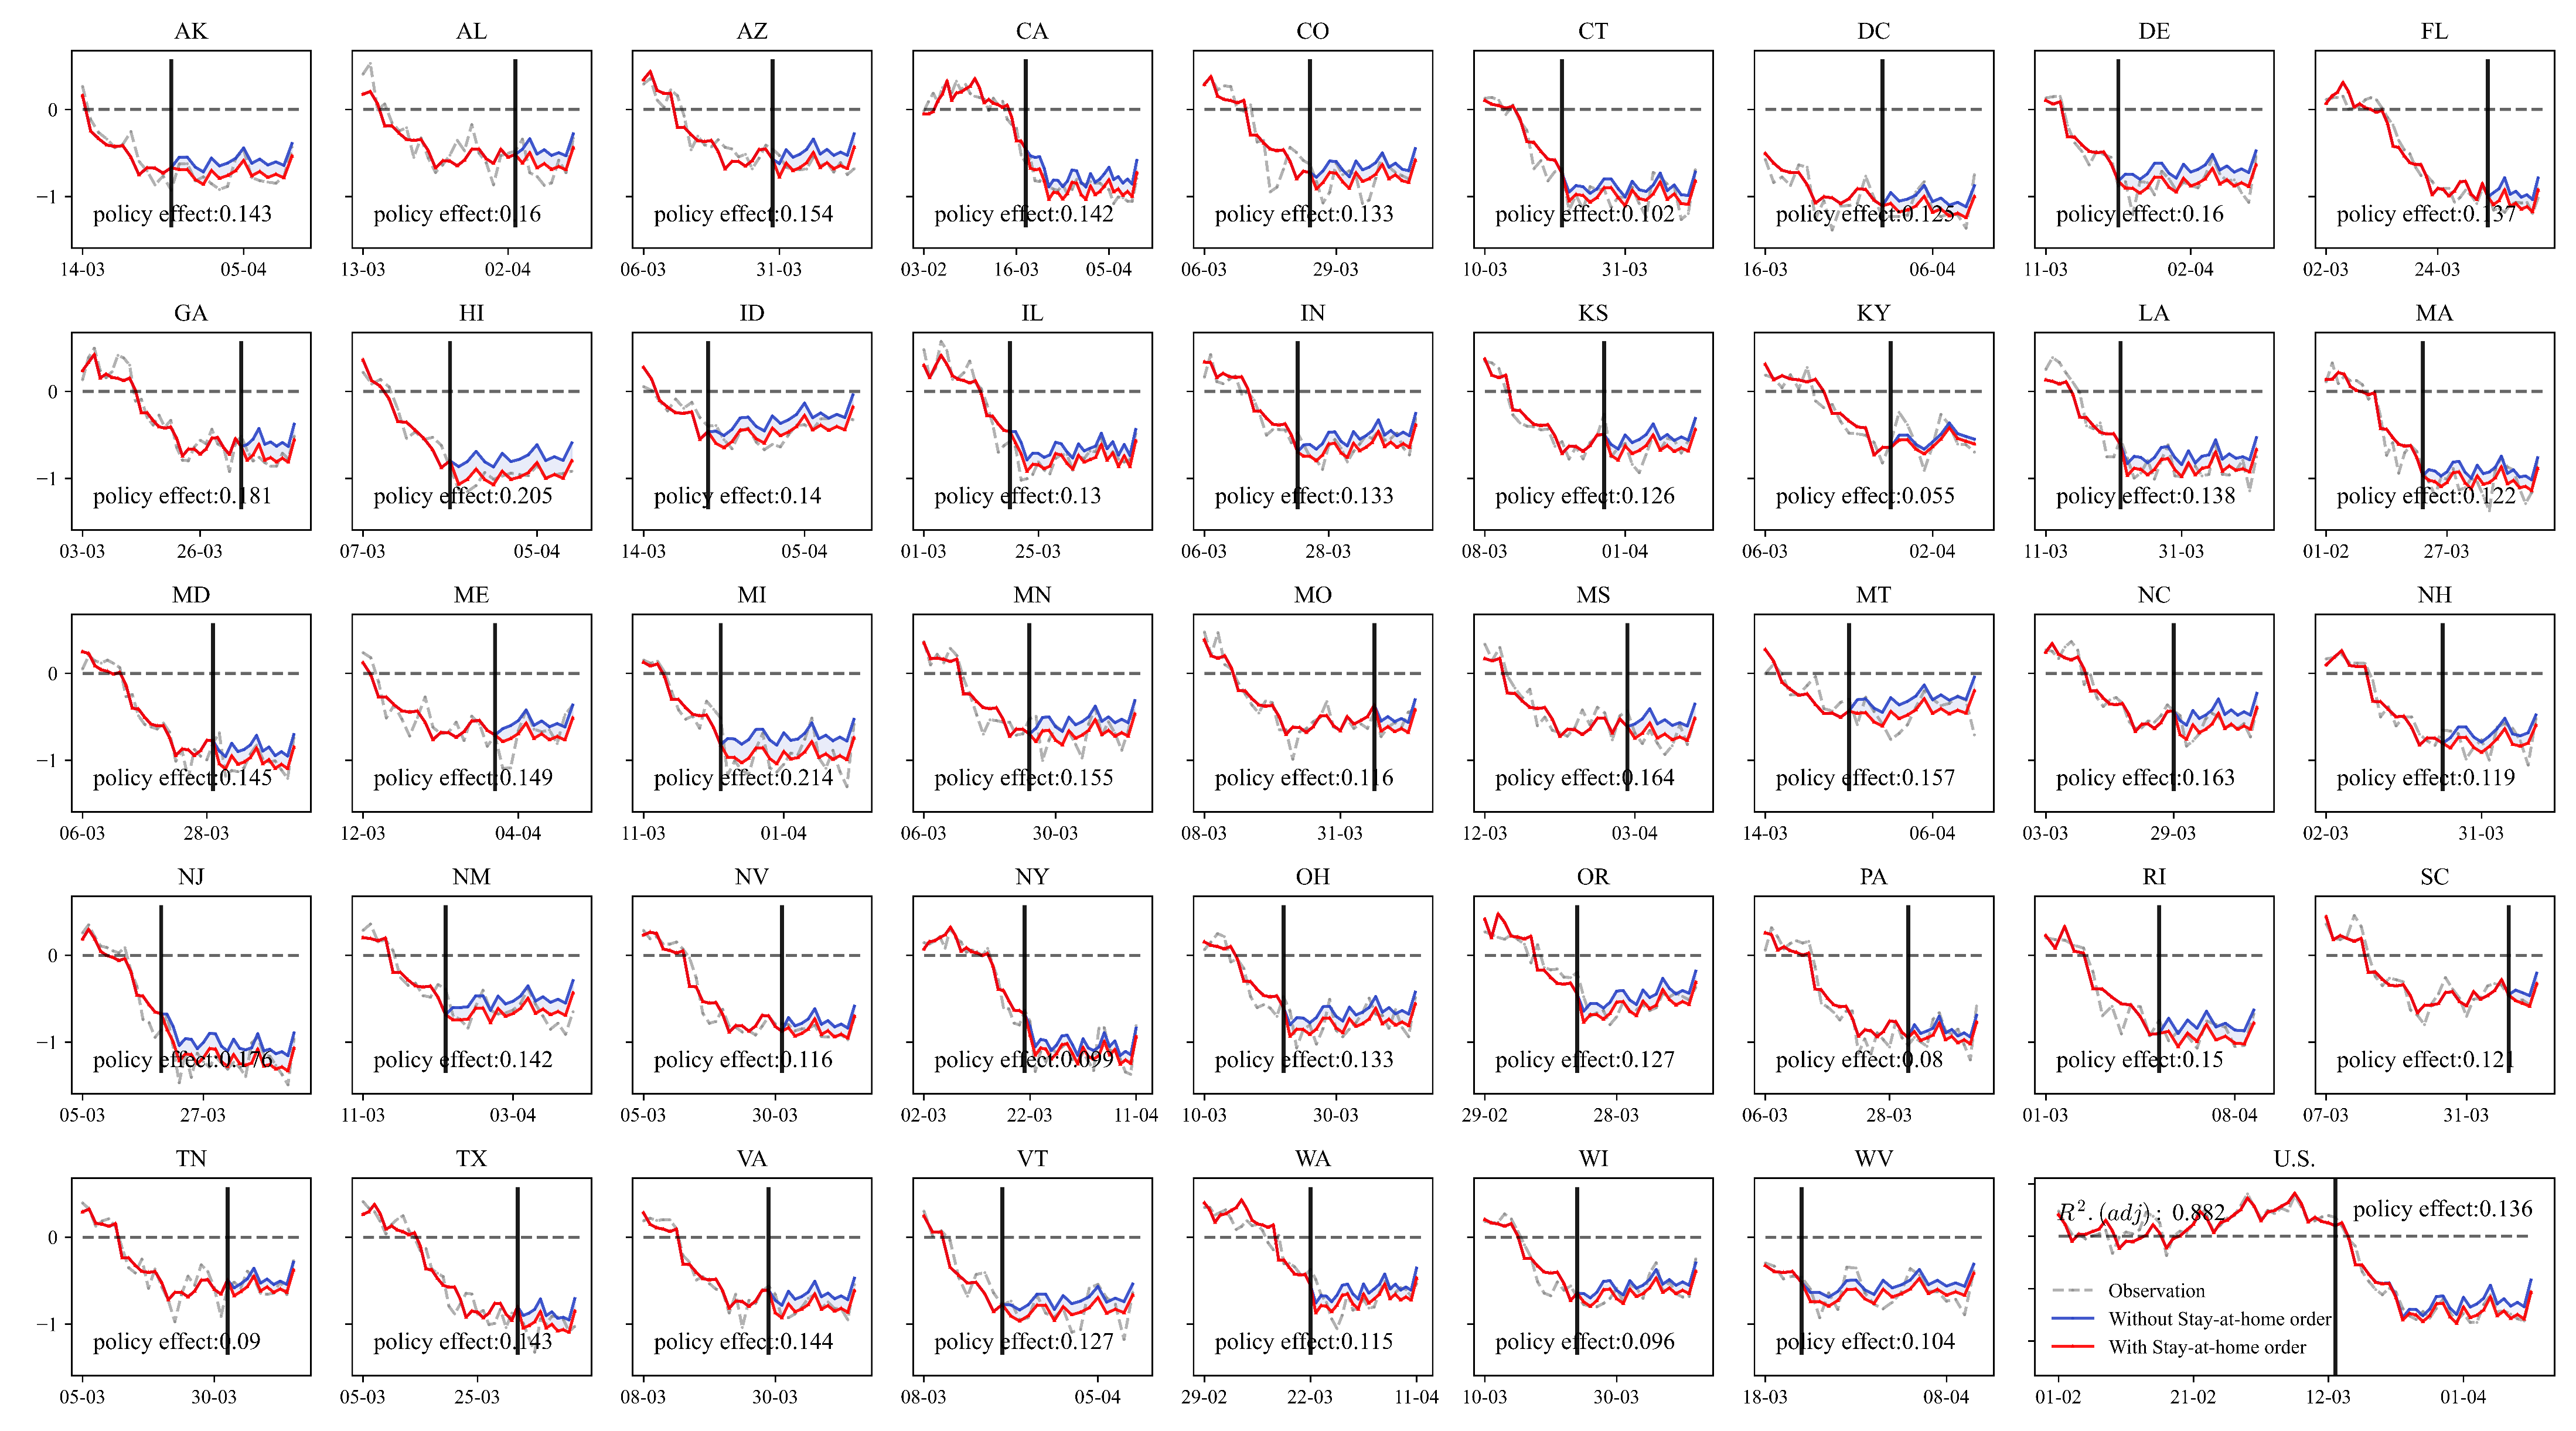
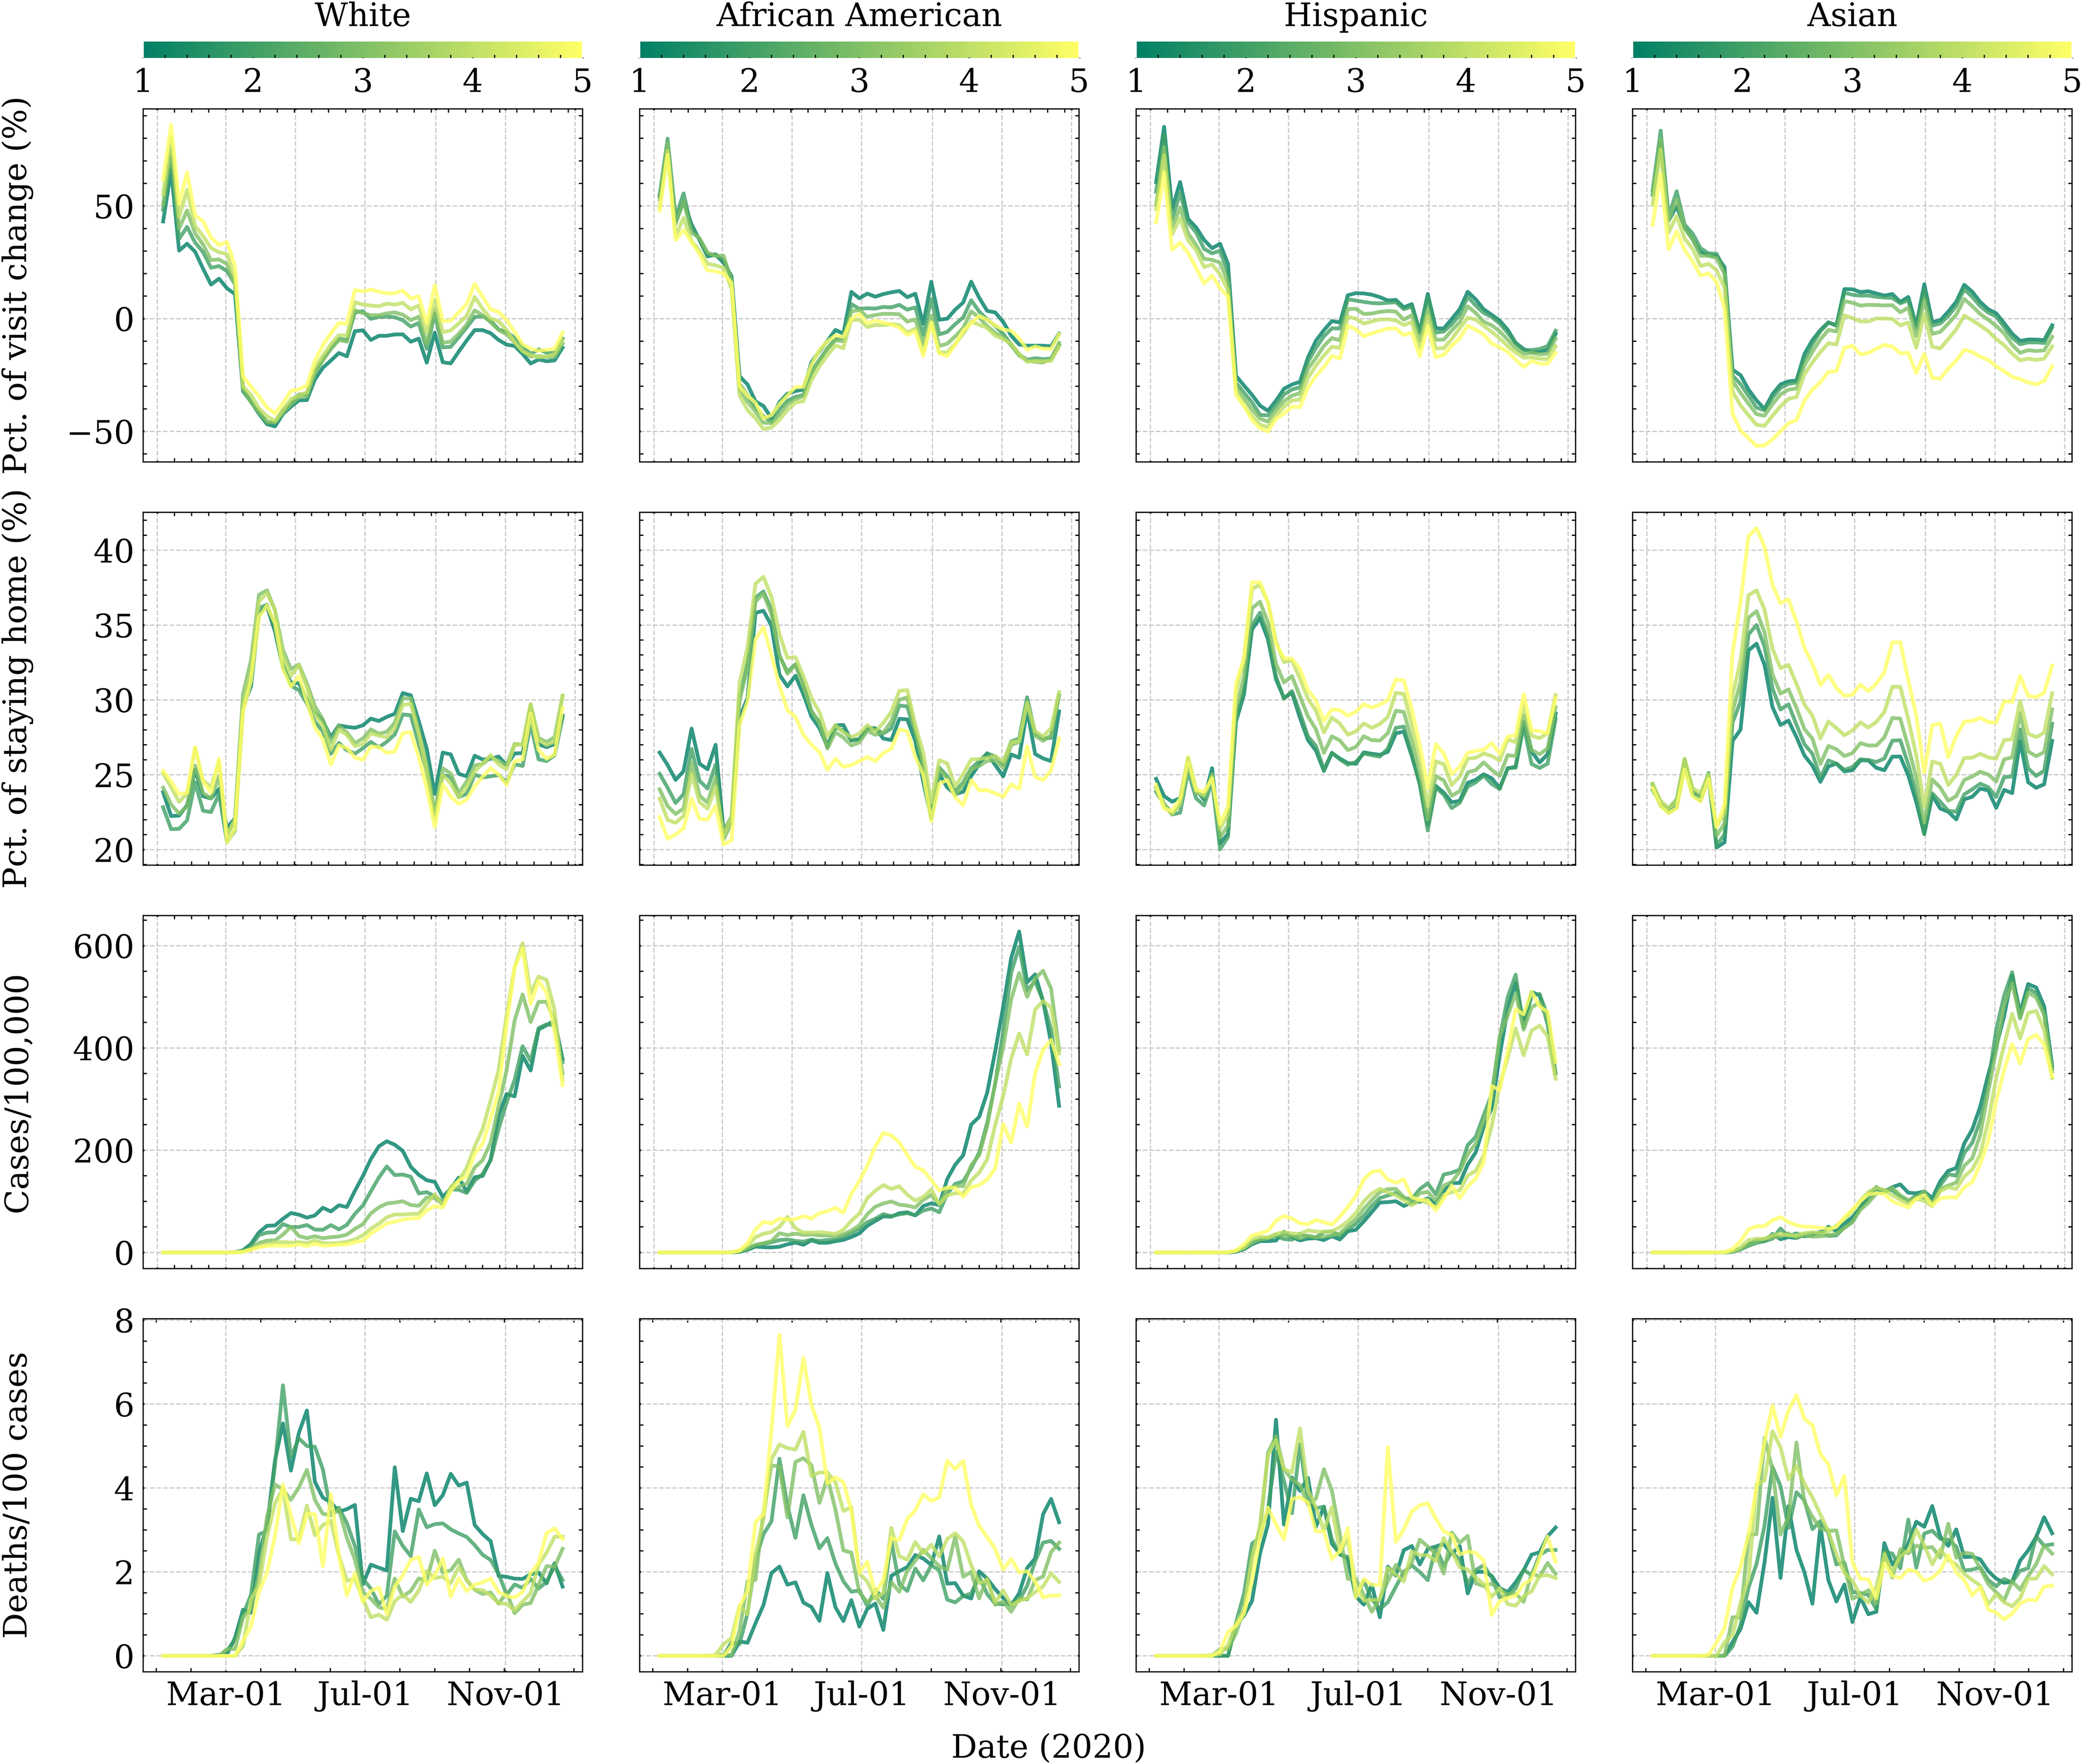
Linking COVID-19 outcomes to demographics, occupation, and politics, we find a structural inequality. Social distancing was a "privilege" of advantaged groups; disadvantaged communities bore the heaviest case and death burdens.
Mediation analysis shows that self-reported vaccine hesitancy does not fully explain US vaccination gaps. Structural access barriers (e.g., distance, time, distrust of institutions) play an equally important role.
Beyond the core themes, I work across travel demand incentives, public sentiment analytics, shared mobility, and multimodal integration.
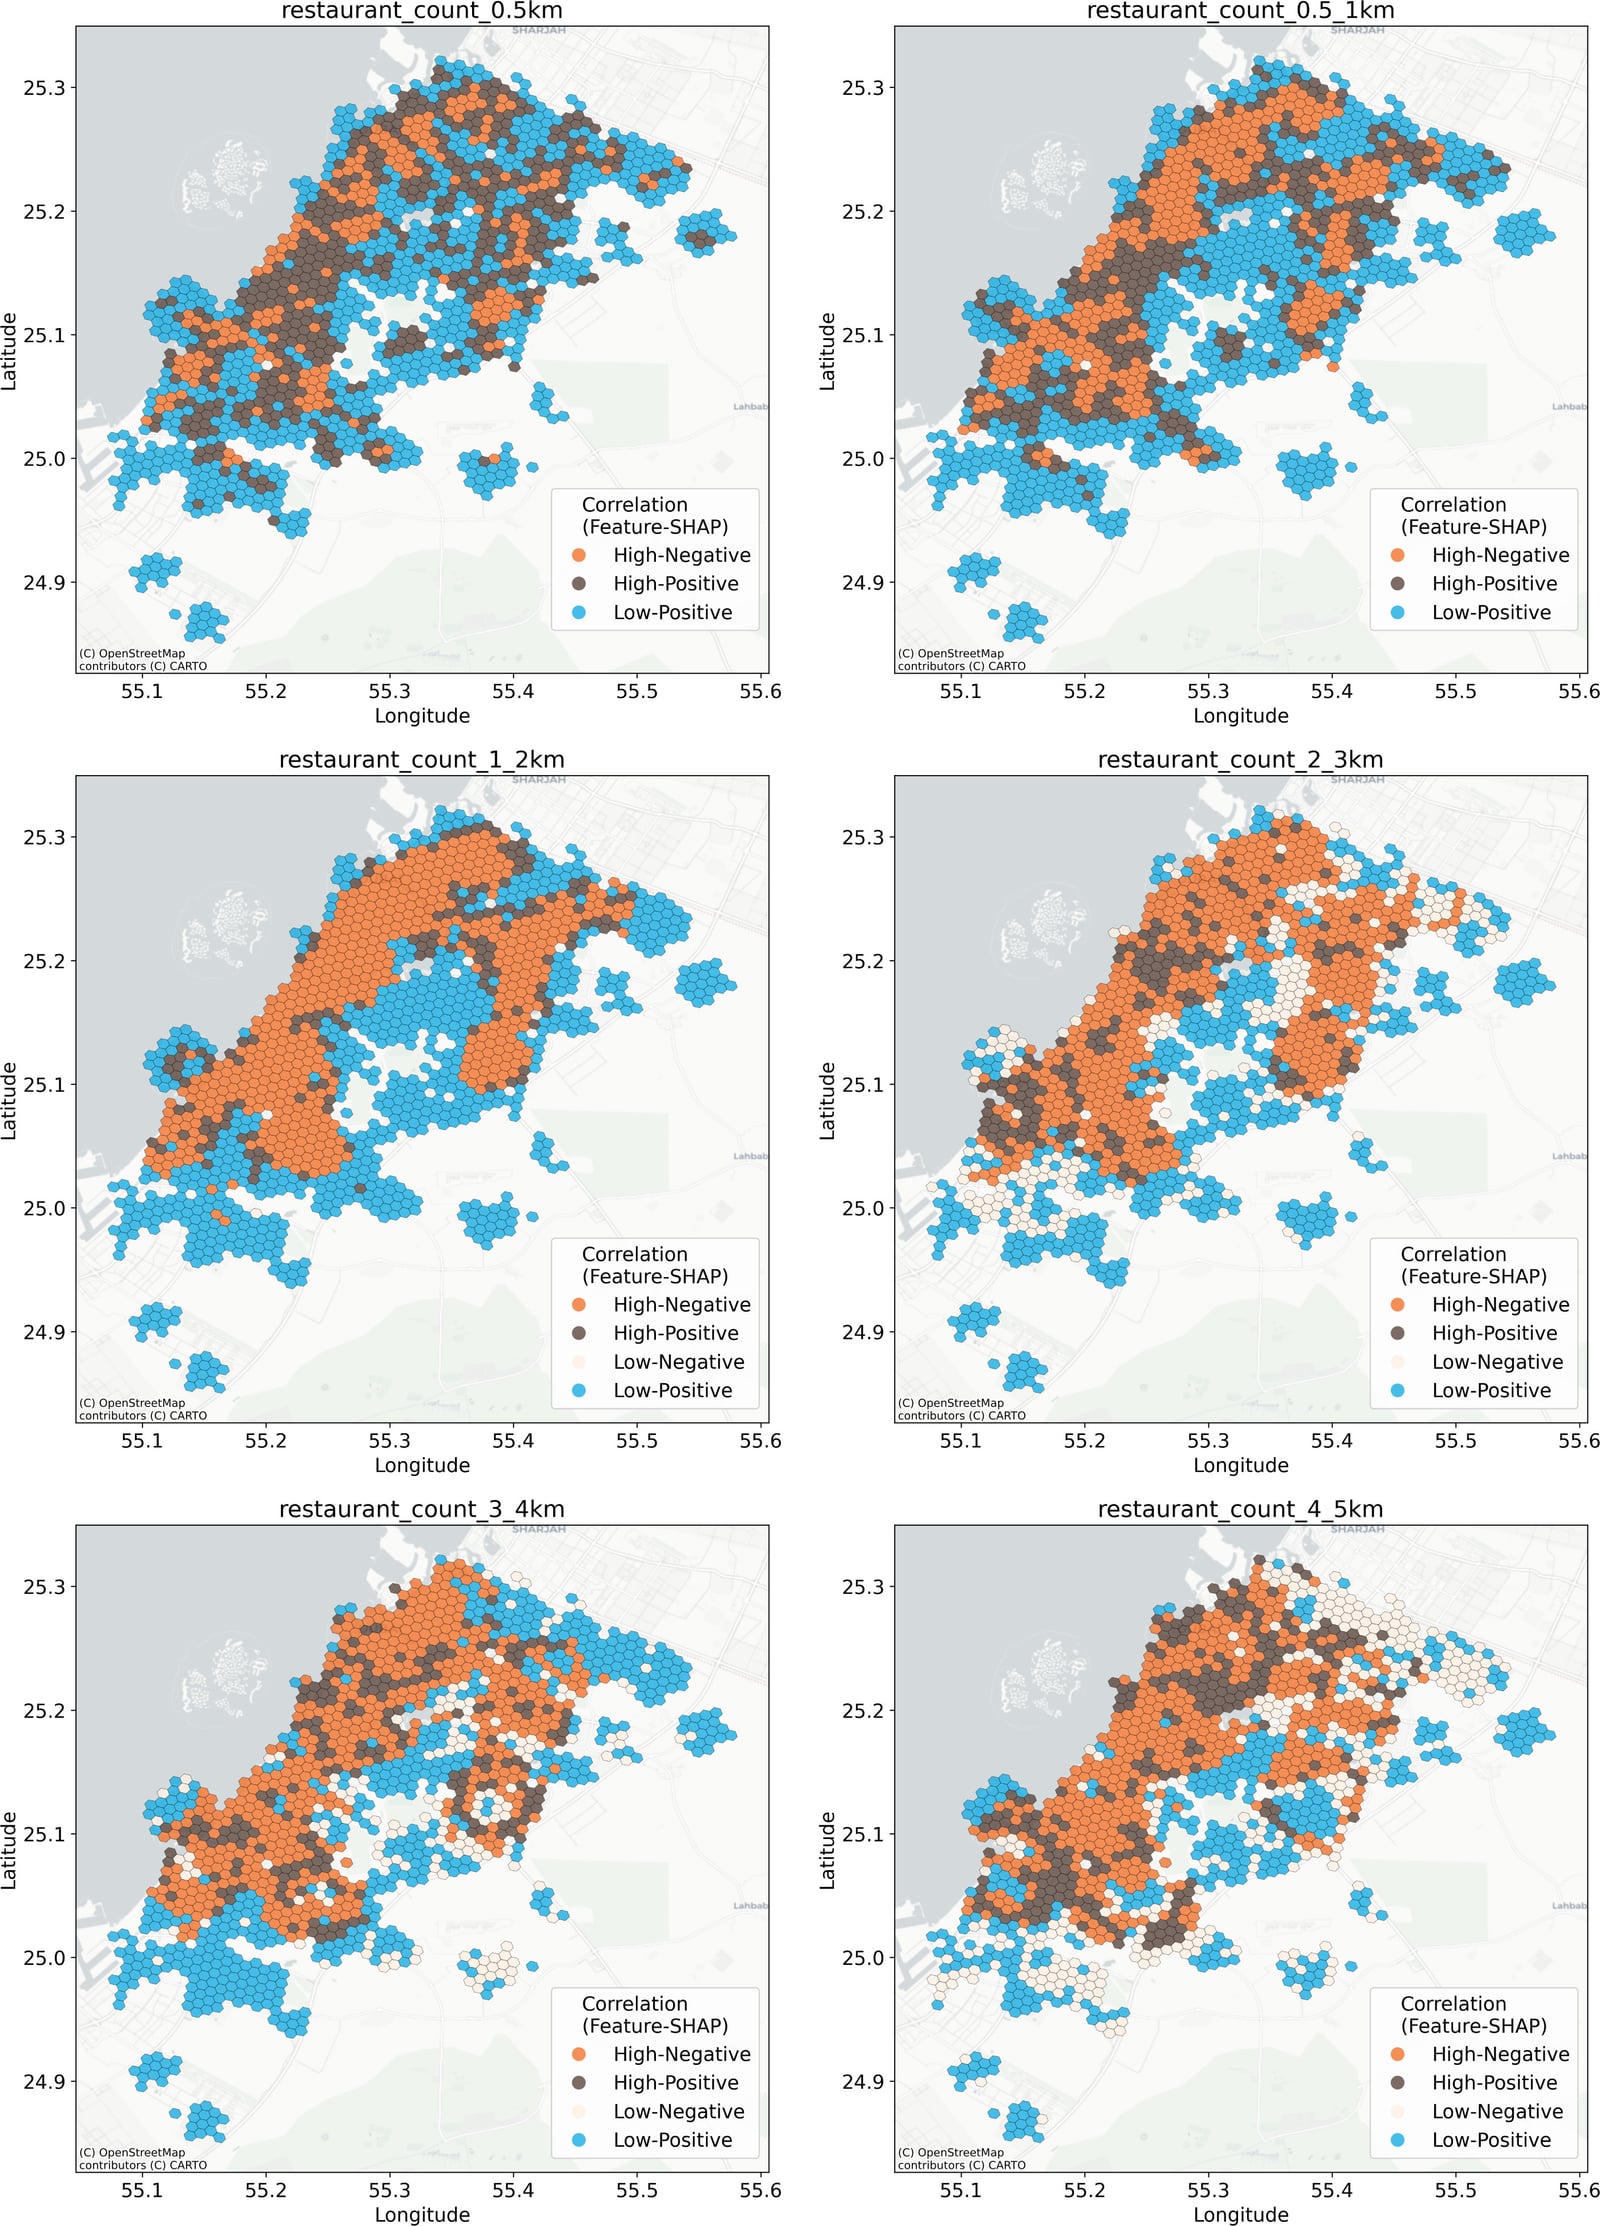
We analyze 2.7 million food delivery orders in Dubai to explain why customers pick distant restaurants over nearby ones. Explainable ML shows that delivery fees, cuisine, ratings, and neighborhood socioeconomics shape whether orders stay local.
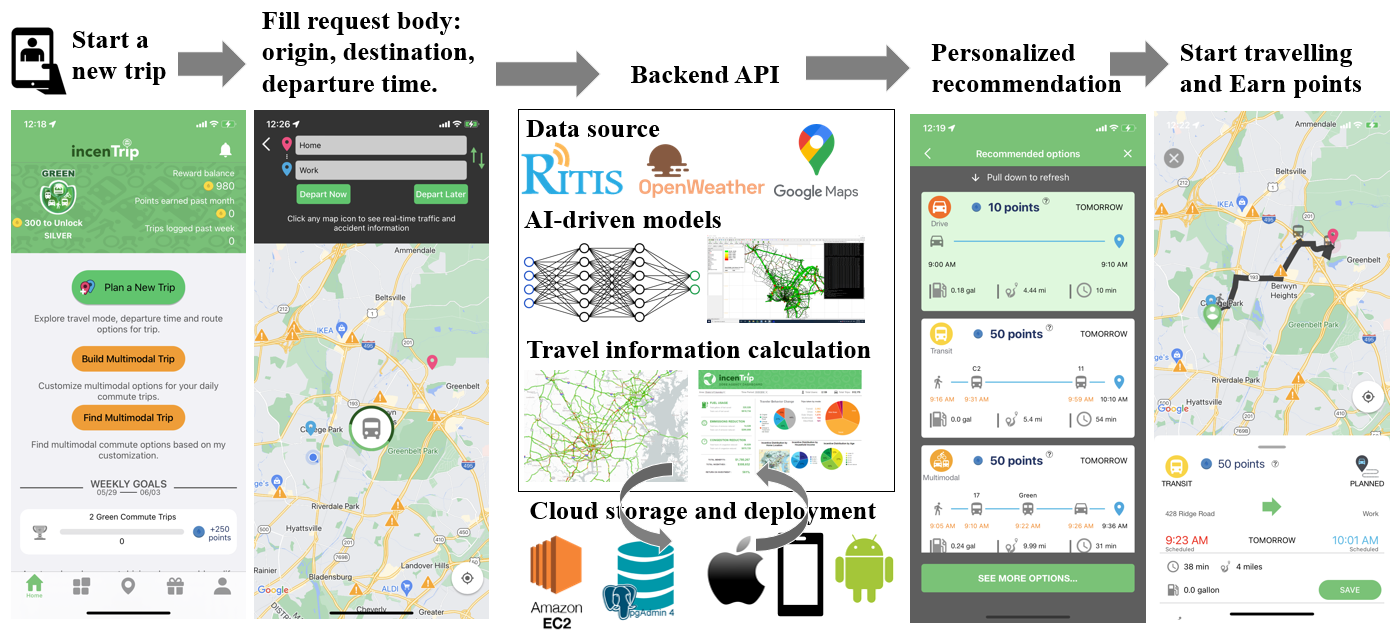
As technical lead of incenTrip, the first nationwide incentive-based travel app, we design personalized rewards that nudge users toward mode switching, carpooling, off-peak travel, and congestion avoidance.
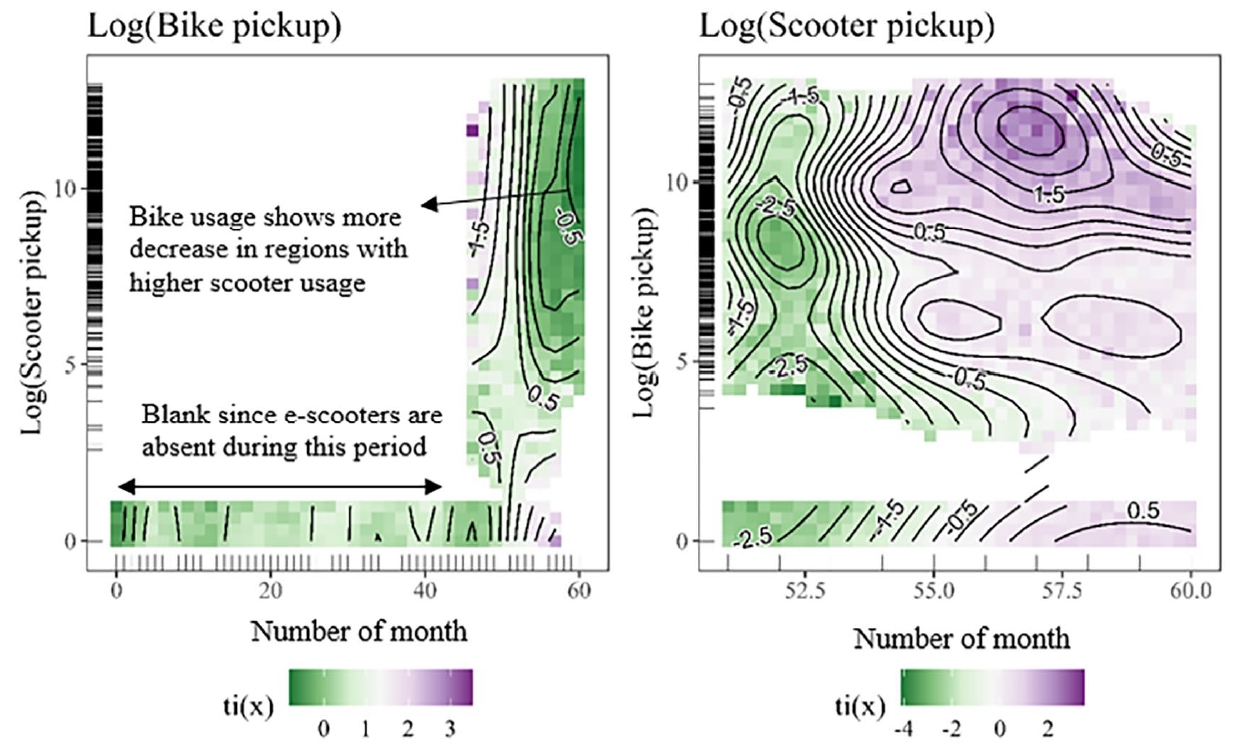
We compare e-scooter sharing with docked bikesharing using generalized additive mixed models. Both thrive in dense, young, higher-income areas, but a one-sided competition has emerged: e-scooters are overtaking bikes.